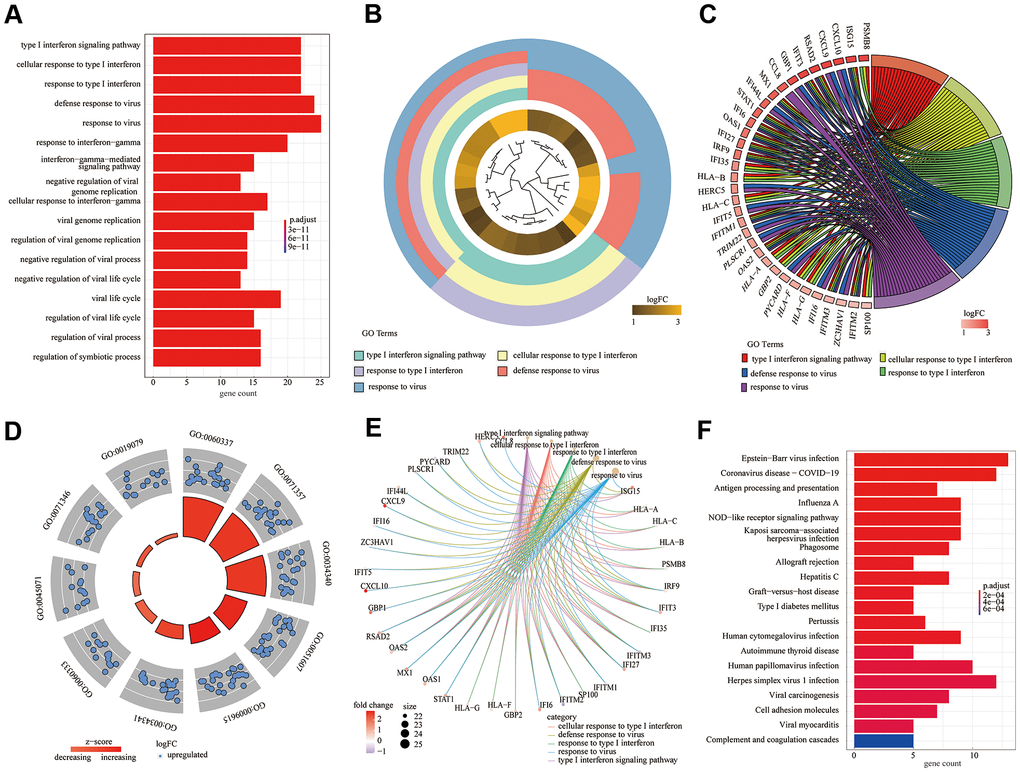
Figure 3.Gene ontology (GO) functional enrichment analysis and Kyoto encyclopedia of genes and genomes (KEGG) pathway analysis of differentially expressed genes. (A) GO bar plot (Figure 3A); (B) GO cluster plot; (C) GO chord plot; (D) GO circle plot; (E) GO cneplot; (F) KEGG bar plot.