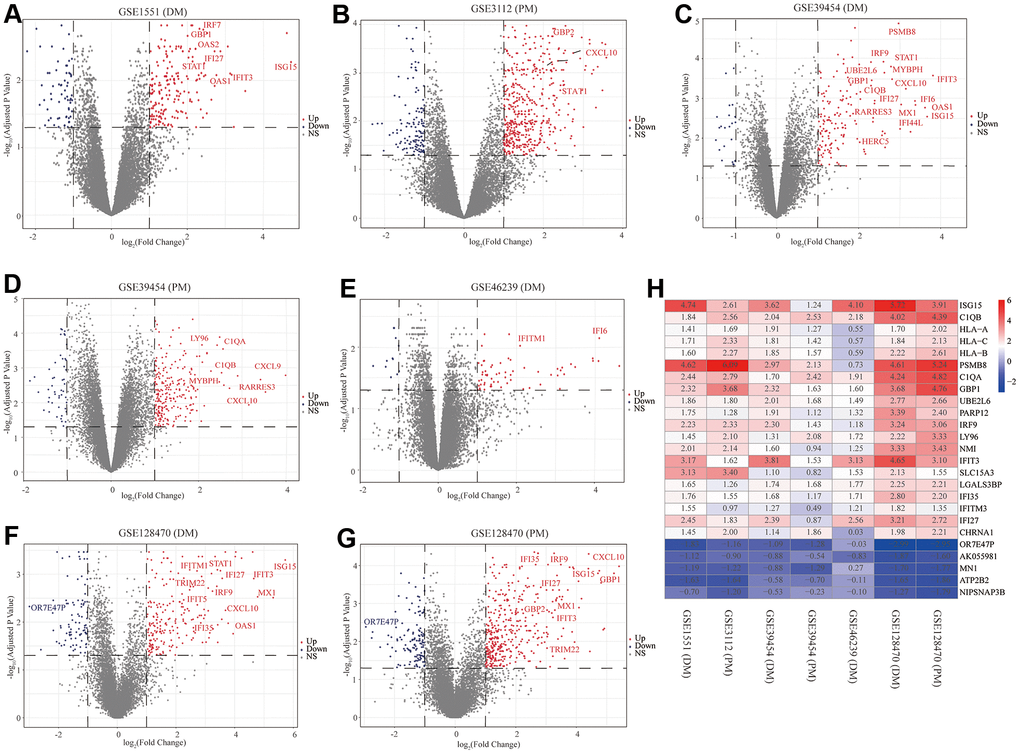
Figure 2.Volcano diagrams of the seven microarrays and heatmap of the robust rank aggregation (RRA) analysis. Red points indicate upregulated genes, while blue points indicate downregulated genes. Gray points indicate genes with no meaningful difference. (A) GSE1551 (dermatomyositis, DM); (B) GSE3112 (polymyositis, PM); (C) GSE39454 (DM); (D) GSE39454 (PM); (E) GSE46239 (DM); (F) GSE128470 (DM); (G) GSE128470 (PM); (H) Heatmap of the top 20 upregulated and five downregulated genes in the RRA method. Red and blue indicate high and low expression of genes in patients with PM/DM, respectively.