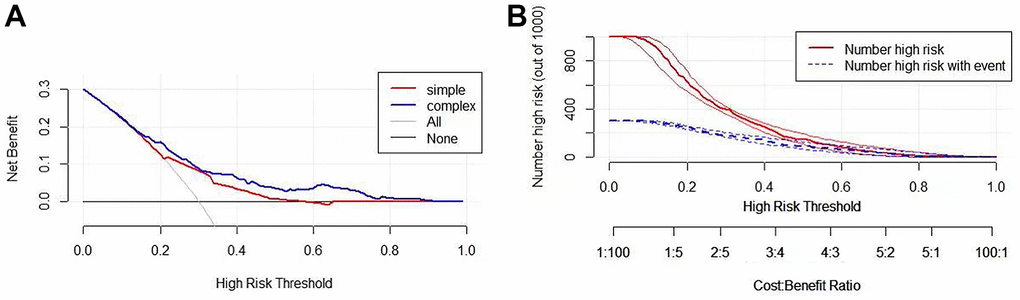
Figure 8.Validation of the clinical value of the prognostic model. (A) Drawing a decision analysis curve: in the Pt range of about 0.1-0.9, this prognostic model has a better clinical application value than A single indicator. (B) Developing clinical impact curves to predict risk stratification of LUAD patients in 1000 persons using simple and complex models.