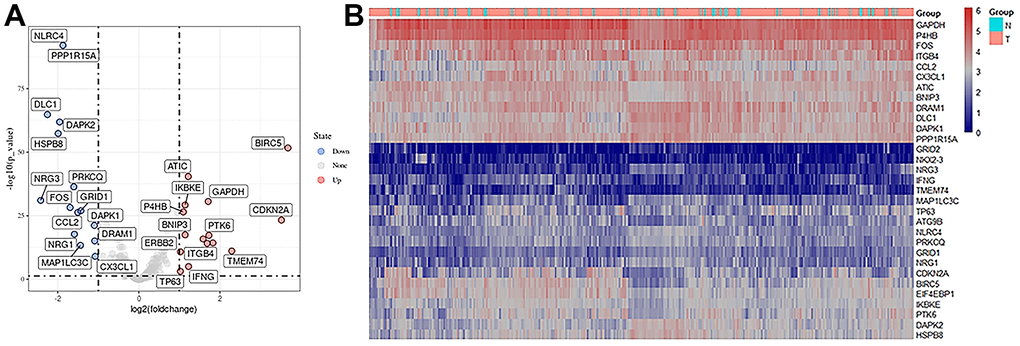
Figure 2.Expression of autophagy-related differential genes. (A) Volcano plot of differentially expressed autophagy-related genes, the horizontal axis was the differential expression multiple (Log2FC>2), the longitudinal axis was -log10(FDR), the blue point was the up-regulated gene, and the red point was the down-regulated gene. (B) Heatmaps of autophagy-related differentially expressed genes, a sample of the horizontal axis and vertical axis for different genes, red for the highly expressed genes, blue for low expressed genes (screening condition:| Log2FC | > 1, adj. p < 0.05).