Submit an Article
Navigate
Home
Editorial Board
Editorial Policies
Current Volume
Archive
Scientific Integrity
Publication Ethics Statements
Interviews with Outstanding Authors
Newsroom
Sponsored Conferences
Podcast
Contact
Special Collections
Submit an Article
Online ISSN: 1945-4589
Research Paper
|
Volume 14, Issue 18
|
pp. 7328–7347
Establishment and validation of individualized clinical prognostic markers for LUAD patients based on autophagy-related genes
Back to article
Figure 10
(10 of 13)
−
100%
+
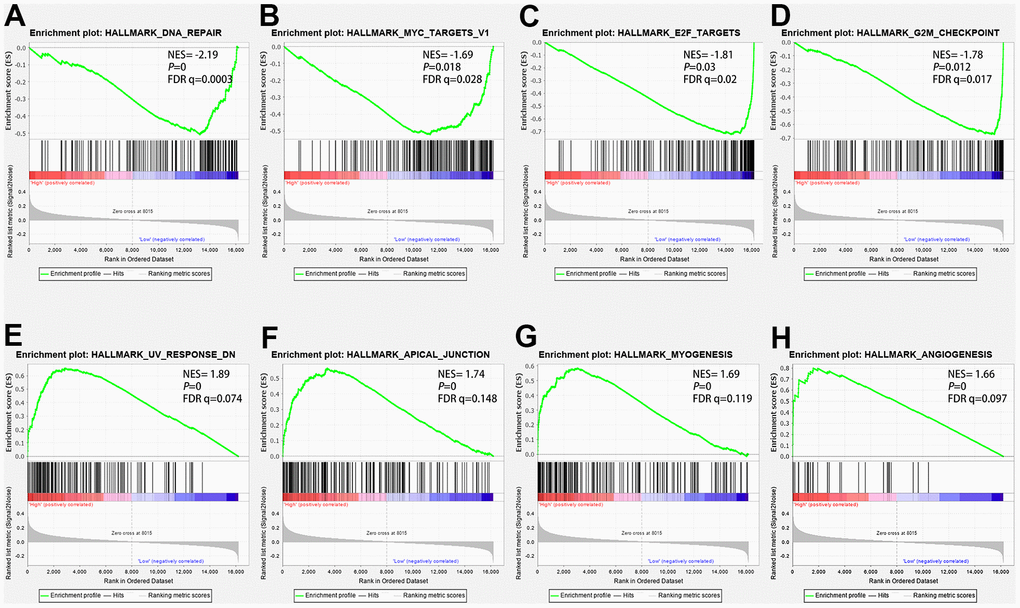
Figure 10.
The GSEA analysis results in the TCGA-LUAD cohort.
(
A
) “DNA repair”, (
B
) “Myc targets V1”, (
C
) “E2F target genes”, (
D
) “G2-M cell-cycle checkpoint”, (
E
) “UV response dn”, (
F
) “Apical junction”, (
G
) “Myogenesis”, (
H
) “angiogenesis”.