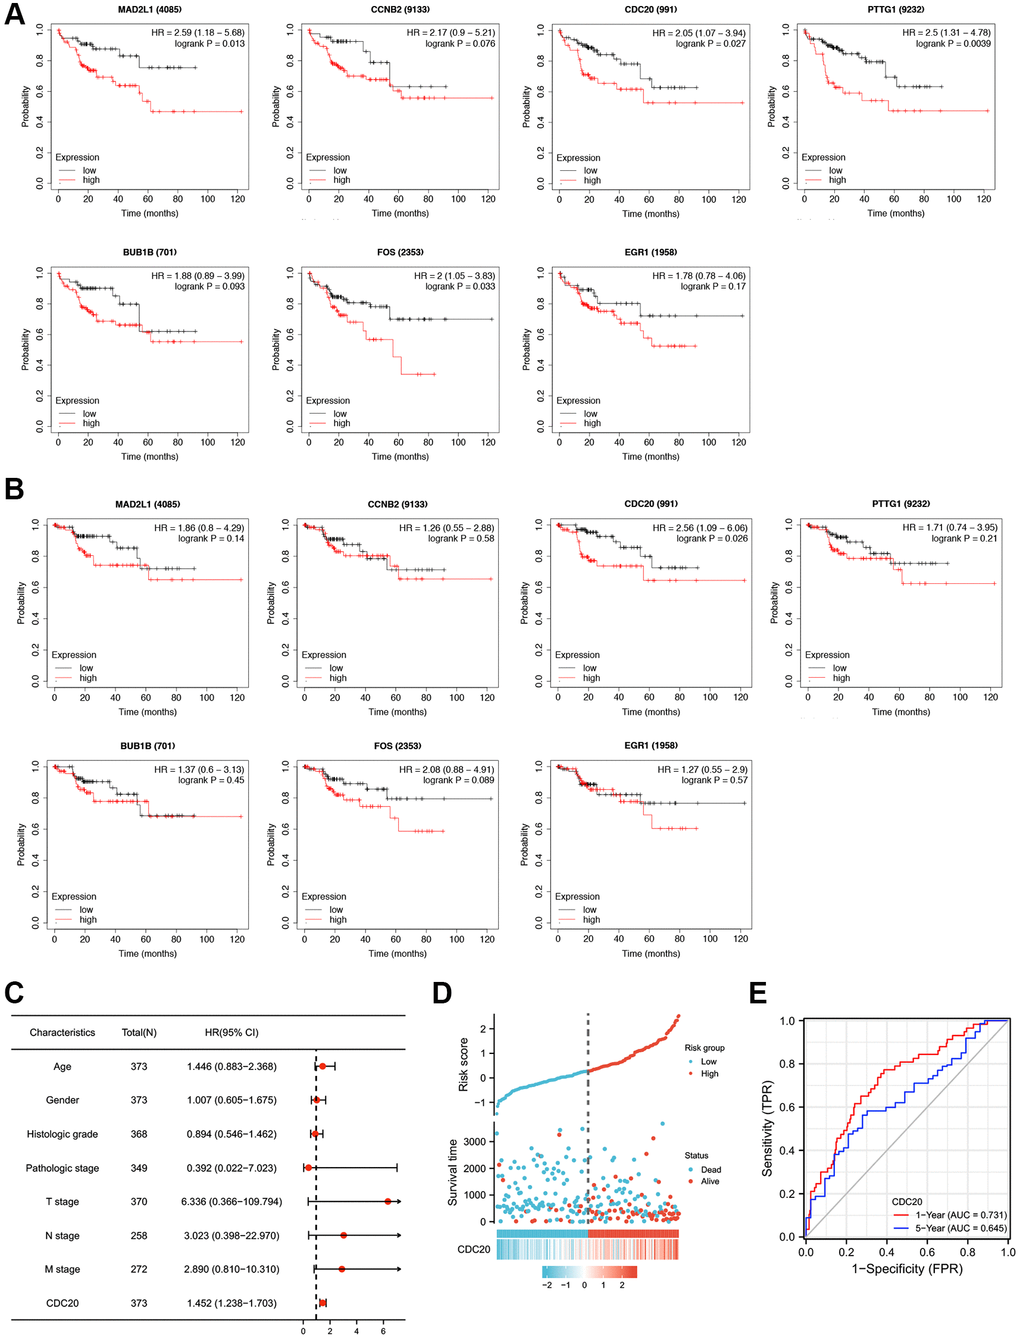
Figure 2.Prognostic values of seven HTLV-1 infection-associated genes including CDC20 in HCC. (A and B) Kaplan-Meier analysis of Overall Survival (OS) (A) and Disease Specific Survival (DSS) (B) in patients with differential expression of each HTLV-1 associated gene. (C) The forest figure revealed the multivariate Cox analysis of CDC20 expression and other clinicopathological variables. (D) CDC20 expression distribution and survival status. (E) ROC curves of CDC20.