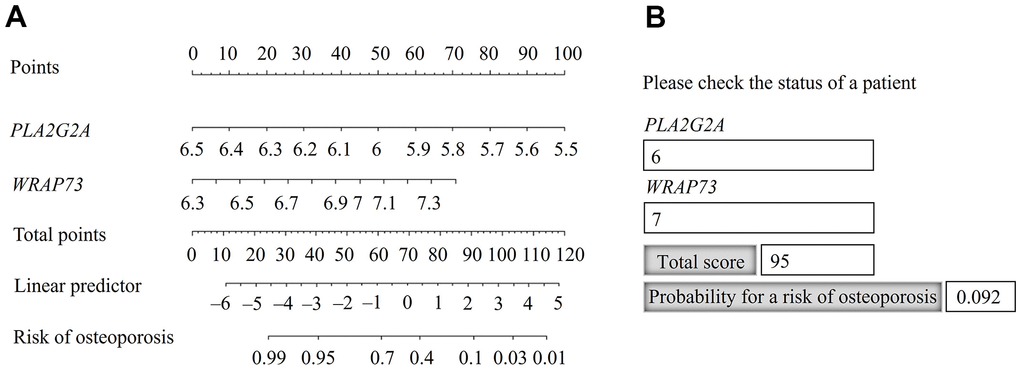
Figure 4.Nomogram for predicting the probability of osteoporosis risk. (A) Identification of the probability of osteoporosis risk for an individual patient. (B) Practical use of the nomogram, available in Hypertext Markup Language (HTML) format.
Figure 4 — Identification of combined biomarkers for predicting the risk of osteoporosis using machine learning | Aging