Submit an Article
Navigate
Home
Editorial Board
Editorial Policies
Current Volume
Archive
Scientific Integrity
Publication Ethics Statements
Interviews with Outstanding Authors
Newsroom
Sponsored Conferences
Podcast
Contact
Special Collections
Submit an Article
Online ISSN: 1945-4589
Research Paper
|
Volume 14, Issue 10
|
pp. 4445–4458
A real-time pluripotency reporter for the long-term and real-time monitoring of pluripotency changes in induced pluripotent stem cells
Back to article
Figure 5
(5 of 5)
−
100%
+
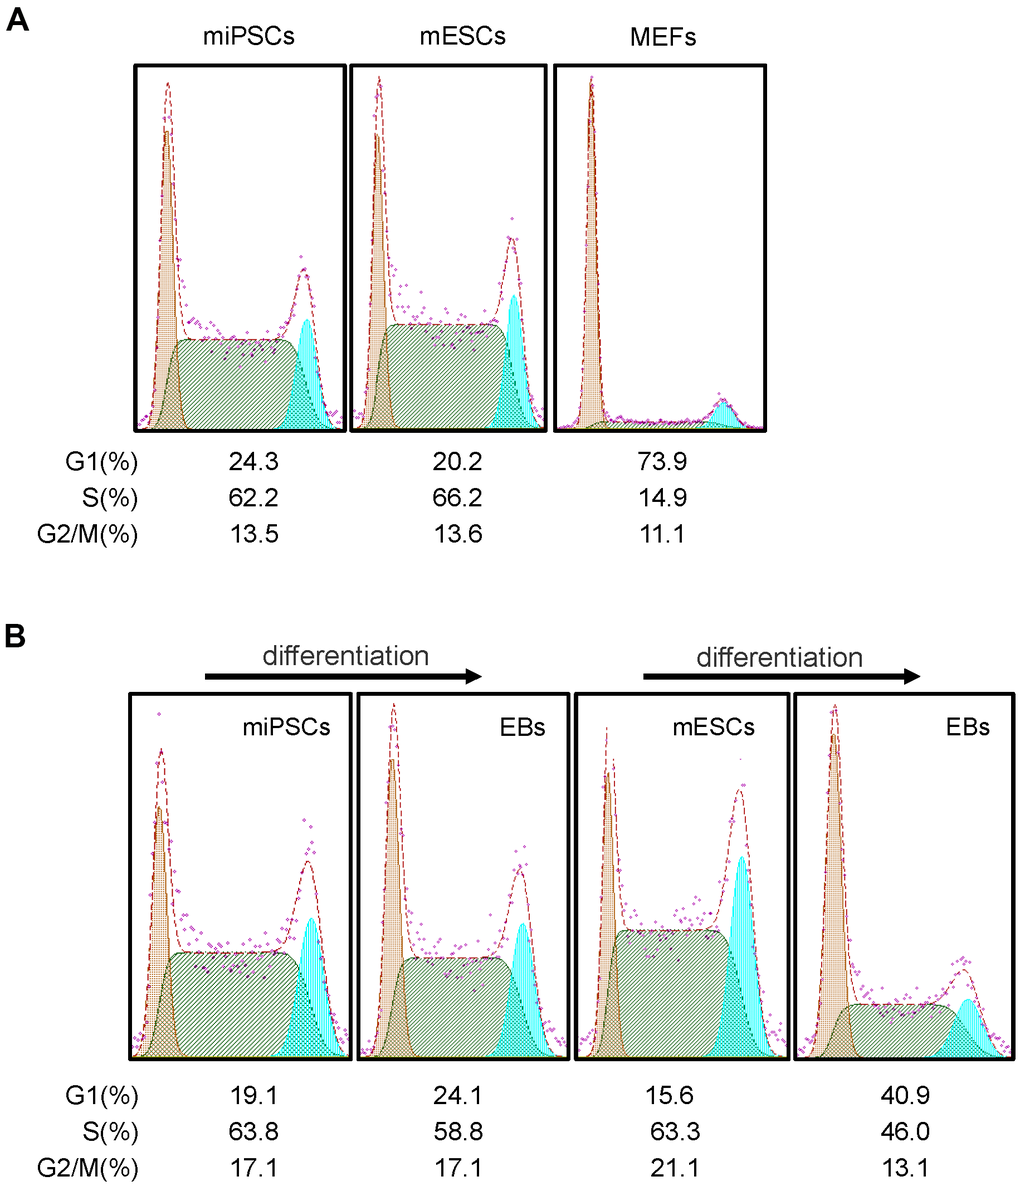
Figure 5.
Cell cycle features of Oct4-EGFP miPSCs.
(
A
) Comparison of cell cycle profiles between miPSCs, mESCs and MEFs. (
B
) miPSCs, mESCs and EBs derived from miPSCs or mESCs were stained with PI and analyzed by flow cytometry.