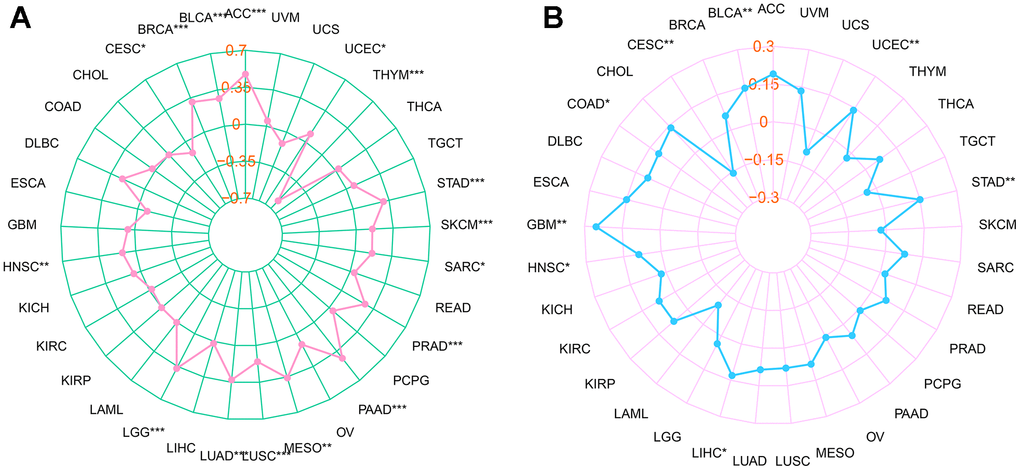
Figure 4.Relationship between RMI2 expression, TMB and MSI in pan-cancer. (A) The relationship between TMB and RMI2. (B) The relationship between MSI and RMI2. Spearman rank correlation test, p <0.05 was regarded as the statistical criteria to set thresholds.