Submit an Article
Navigate
Home
Editorial Board
Editorial Policies
Current Volume
Archive
Scientific Integrity
Publication Ethics Statements
Interviews with Outstanding Authors
Newsroom
Sponsored Conferences
Podcast
Contact
Special Collections
Submit an Article
Online ISSN: 1945-4589
Research Paper
|
Volume 14, Issue 9
|
pp. 4085–4106
A novel lncRNA-miRNA-mRNA triple network identifies lncRNA XIST as a biomarker for acute myocardial infarction
Back to article
Figure 8
(8 of 8)
−
100%
+
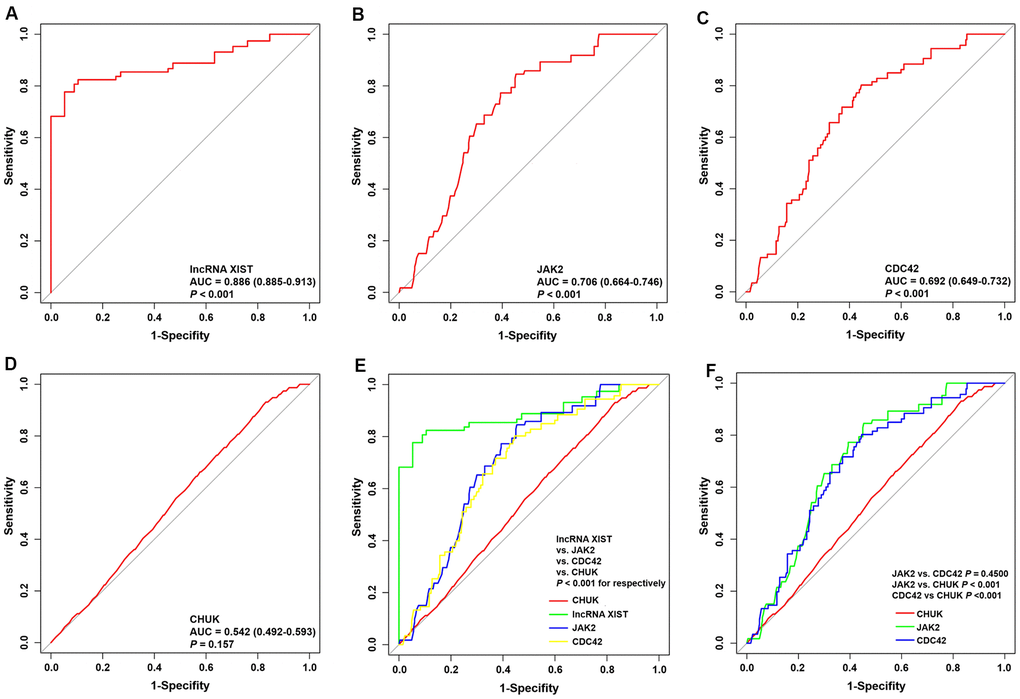
Figure 8.
ROC curve analyses of one lncRNA and three genes for the diagnosis of AMI.
(
A
–
D
) ROC curve analysis of lncRNA
XIST
,
JAK2
,
CDC42
and
CHUK
genes. (
E
,
F
) The pairwise
P
-value comparison.