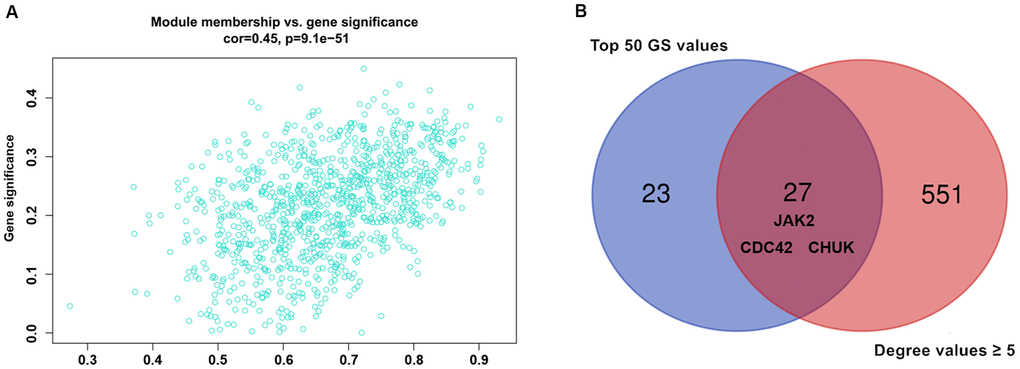
Figure 3.(A) Association between gene significance and module membership. Scatterplot shows a highly significant correlation between gene significant (GS) versus module membership (MM) with AMI in the turquoise module. (B) key genes with top 50 GS values and they degree values ≥ 5 were defined by Venn diagram.