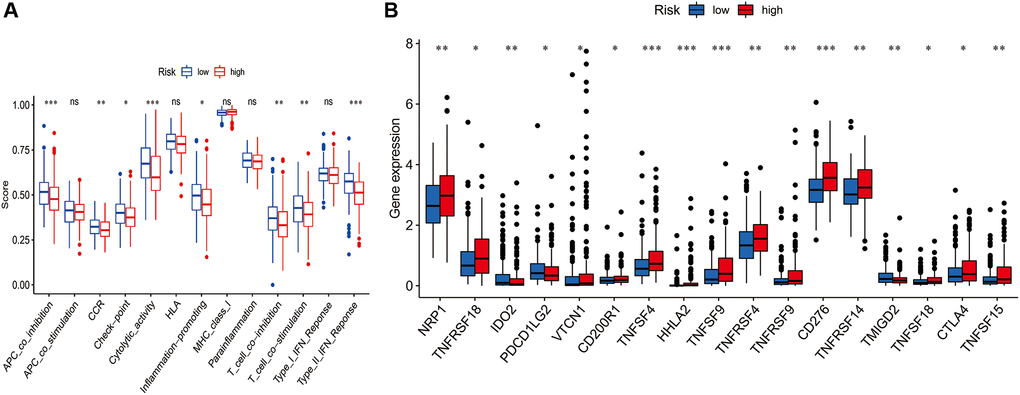
Figure 9.Comparison of the single sample gene set enrichment analysis (ssGSEA) scores for immune-related functions and immune checkpoints between different risk groups. (A) ssGSEA for the immune functions between high-risk (red box) and low-risk (blue box) groups HCC patients. (B) The expression levels of immune checkpoints between high-risk (red box) and low-risk (blue box) groups HCC patients. (*P < 0.05, **P < 0.01, and ***P < 0.001).