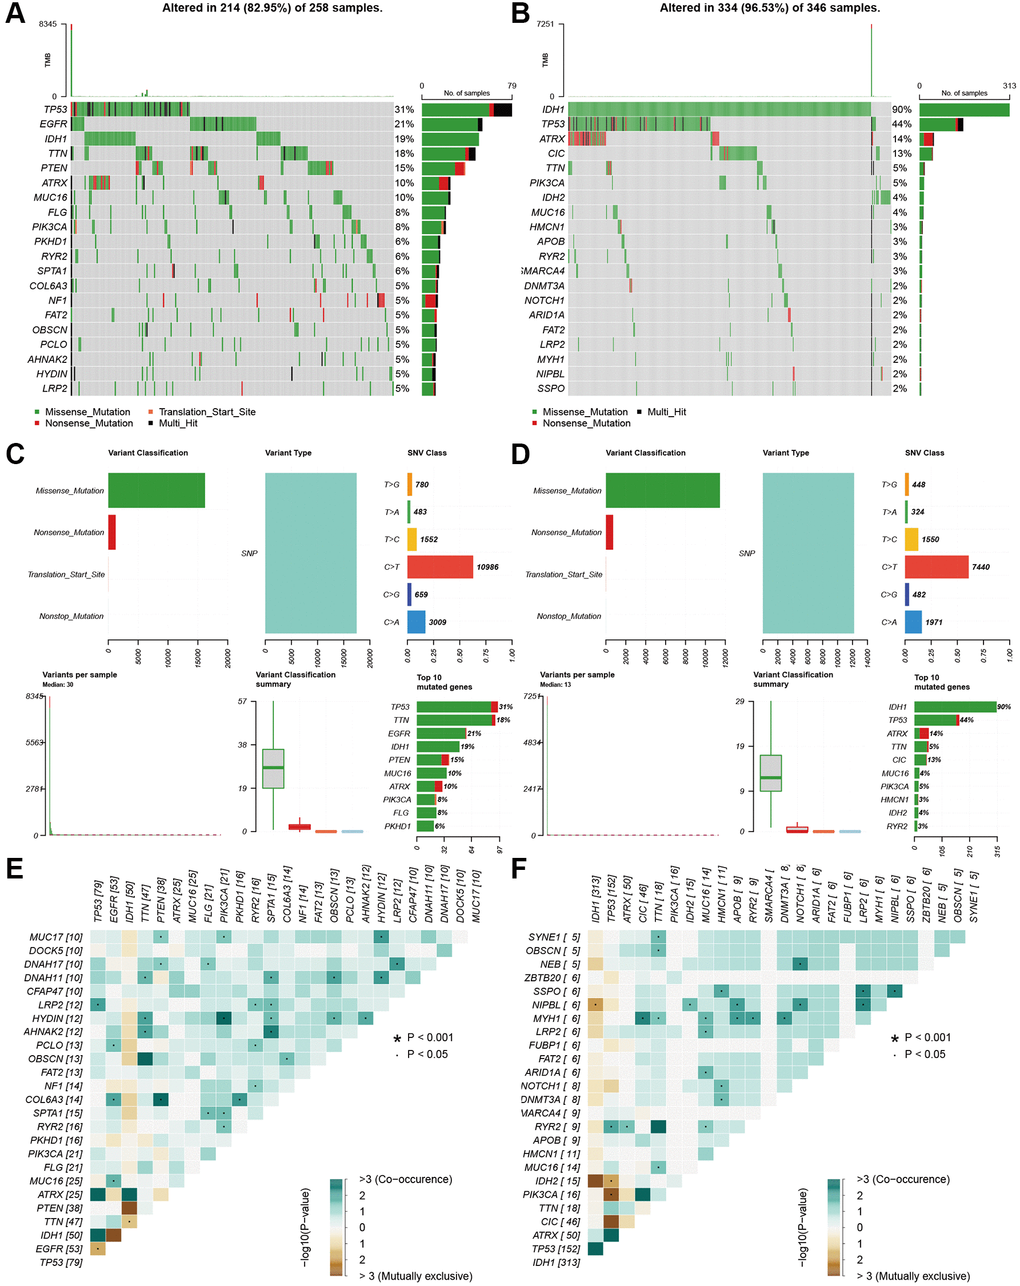
Figure 7.Landscape of mutation profiles between high- and low-risk groups. (A and B) Waterfall plots of mutation information in each sample. (C and D) Bar graph of variant classification. (E and F) somatic interactions plot (co-occurrence and exclusive).