Submit an Article
Navigate
Home
Editorial Board
Editorial Policies
Current Volume
Archive
Scientific Integrity
Publication Ethics Statements
Interviews with Outstanding Authors
Newsroom
Sponsored Conferences
Podcast
Contact
Special Collections
Submit an Article
Online ISSN: 1945-4589
Research Paper
|
Volume 14, Issue 9
|
pp. 4050–4068
Comprehensive analysis of histone deacetylases genes in the prognosis and immune infiltration of glioma patients
Back to article
Figure 10
(10 of 10)
−
100%
+
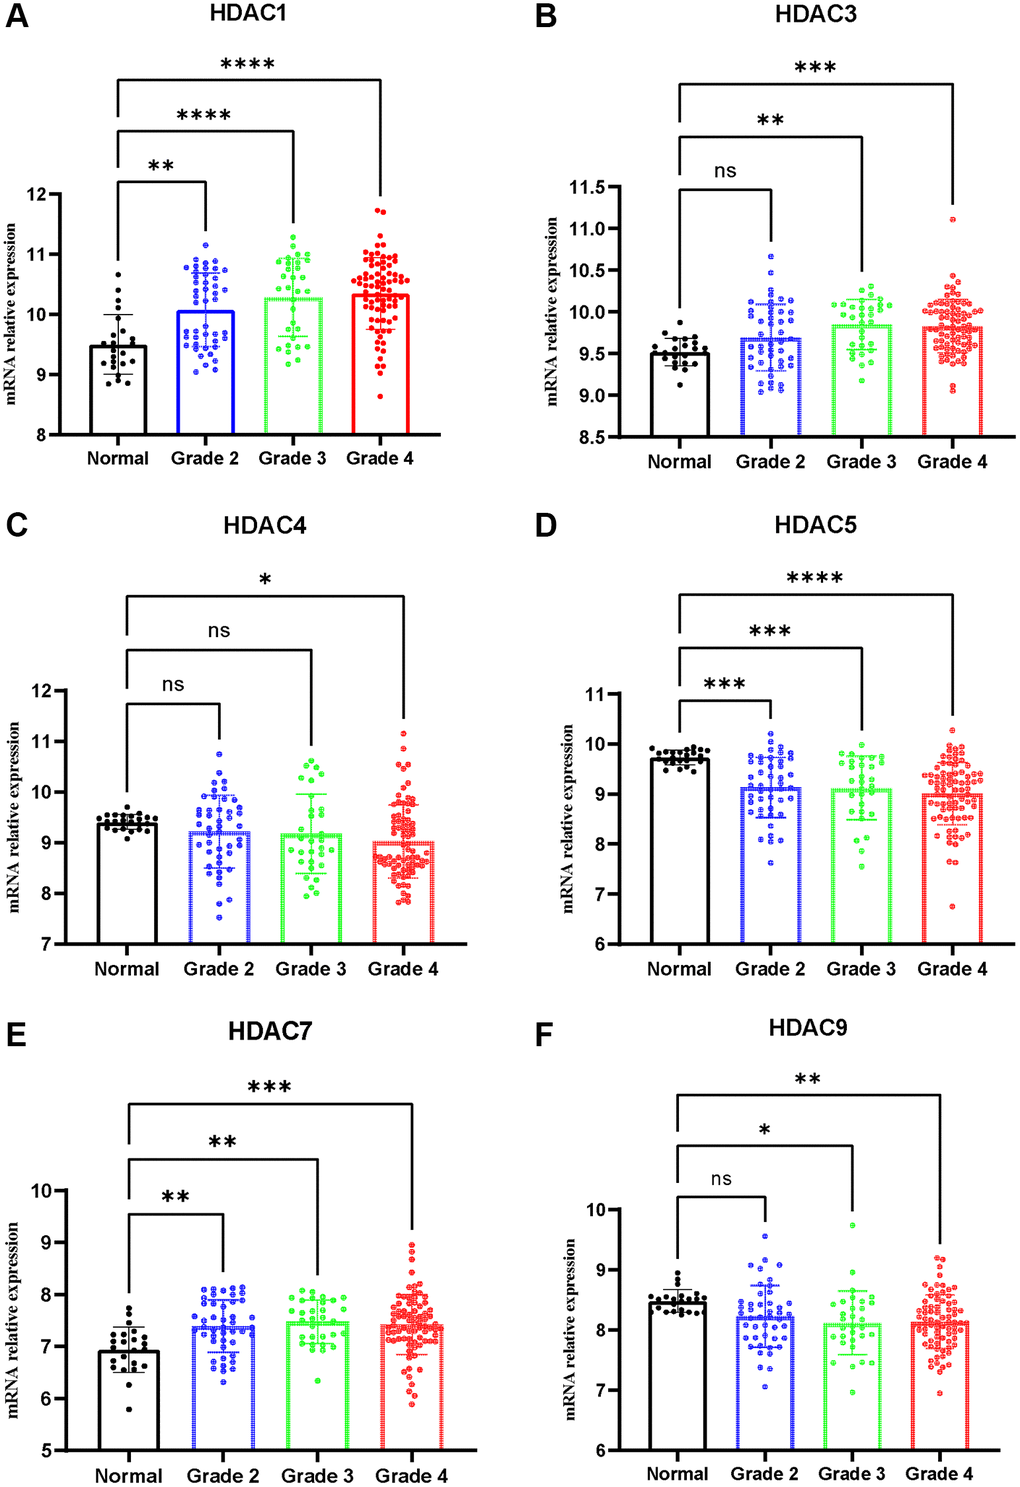
Figure 10.
Expression of HDAC genes in glioma and non-tumor tissue.
(
A
) HDAC1, (
B
) HDAC3, (
C
) HDAC4, (
D
) HDAC5, (
E
) HDAC7, (
F
) HDAC9.