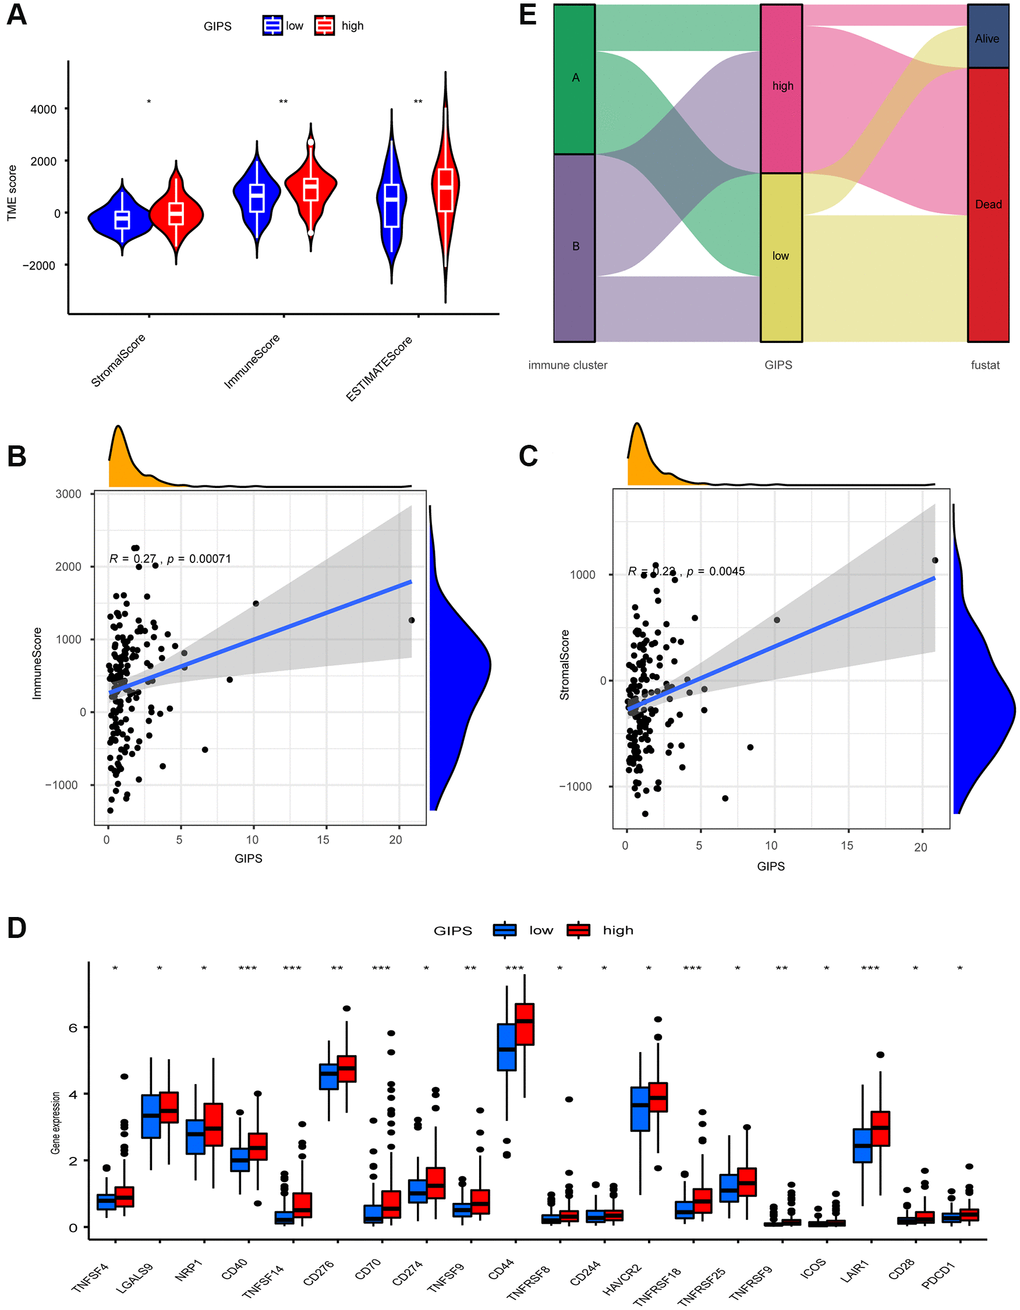
Figure 5.TME Characterization of distinct GIPS subgroups. (A) TME scores of the distinct GIPS subgroups. (B) Spearman correlation analysis of GIPS scores with immune scores. R = 0.27, P ≤ 0.001. (C) Spearman correlation analysis of GIPS scores with stromal scores. R = 0.22, P ≤ 0.01. (D) Differential analysis of expression of immune checkpoints in the different GIPS subgroups. (E) Alluvial diagram of GBM patient immune cluster and GIPS.