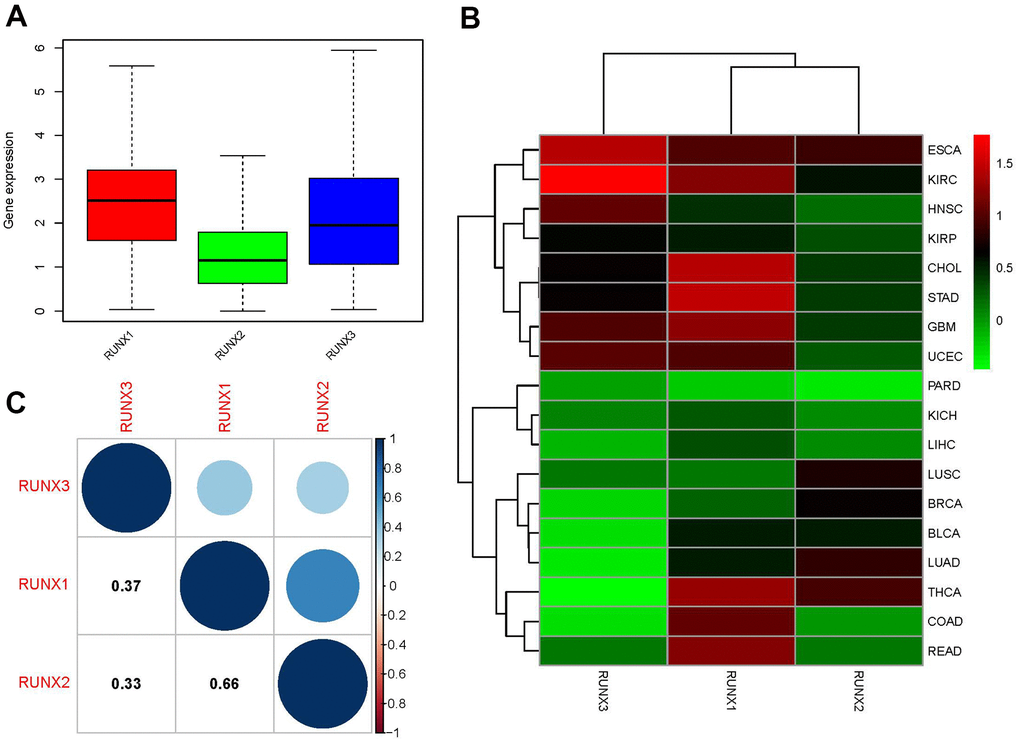
Figure 2.Expression levels and correlations of RUNX gene family genes in different cancer types from TCGA. (A) Boxplot of RUNX gene family gene expression across various cancer types. (B) Heatmap of RUNX gene family gene expression levels in different cancer types and normal tissues from TCGA data. (C) Positive (blue) and negative (red) correlations between RUNX gene family genes.