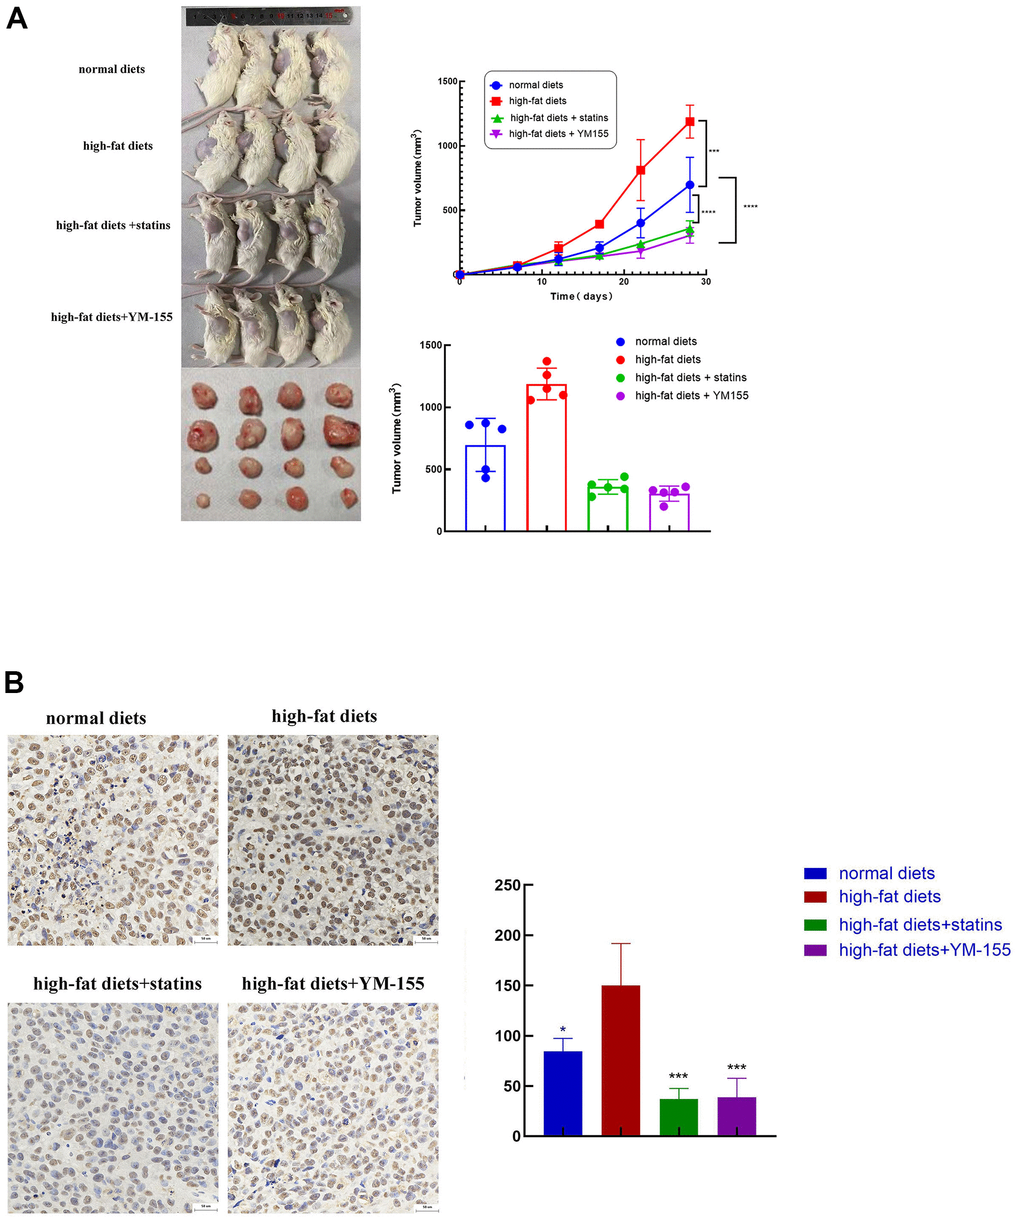
Figure 9.ILF3 promoted tumor cell growth in vivo. (A) Images of nude mouse tumorigenesis test after four weeks of implantation. Comparison of tumor volume between normal diets, high-fat diets, high-fat diets+statin and high-fat diets + ILF3 inhibitor-YM155. Tumors in high-fat diet group were bigger than normal diet group. Tumors in statin and ILF3 inhibitor-YM-155 groups were smaller than high-fat diet group. (B) Immunohistochemistry showed that the expression of ILF3 in normal diets, high-fat diets, high-fat diets+statin and high-fat diets + ILF3 inhibitor-YM155 groups. **P < 0.01, ***P < 0.001, ****P < 0.0001.