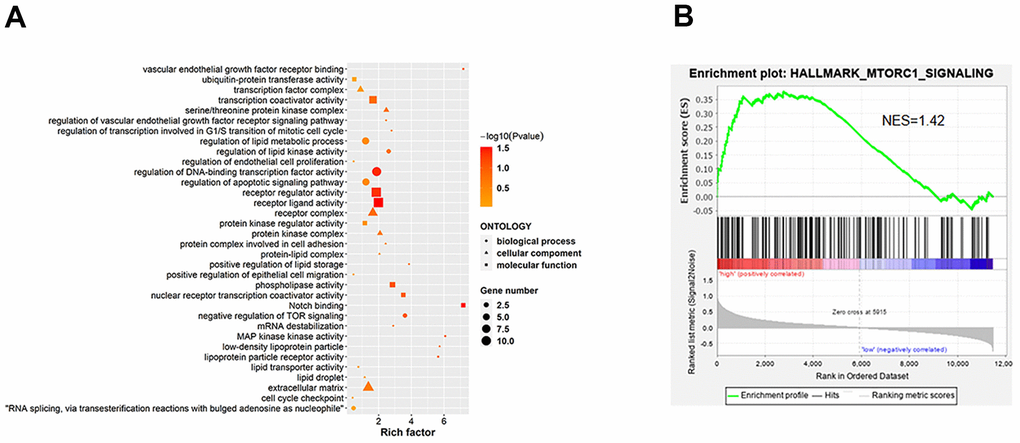
Figure 4.KEGG enrichment analysis between the si-ILF3 group and si-nc group in gastric cancer cell SGC-7901. (A) KEGG analysis showed the signaling pathways that ILF3 was involved in gastric cancer cell SGC-7901. (B) Results of the GSEA showed that ILF3 participated in the regulation of mTOR signaling pathway. NES = normalized enrichment score.