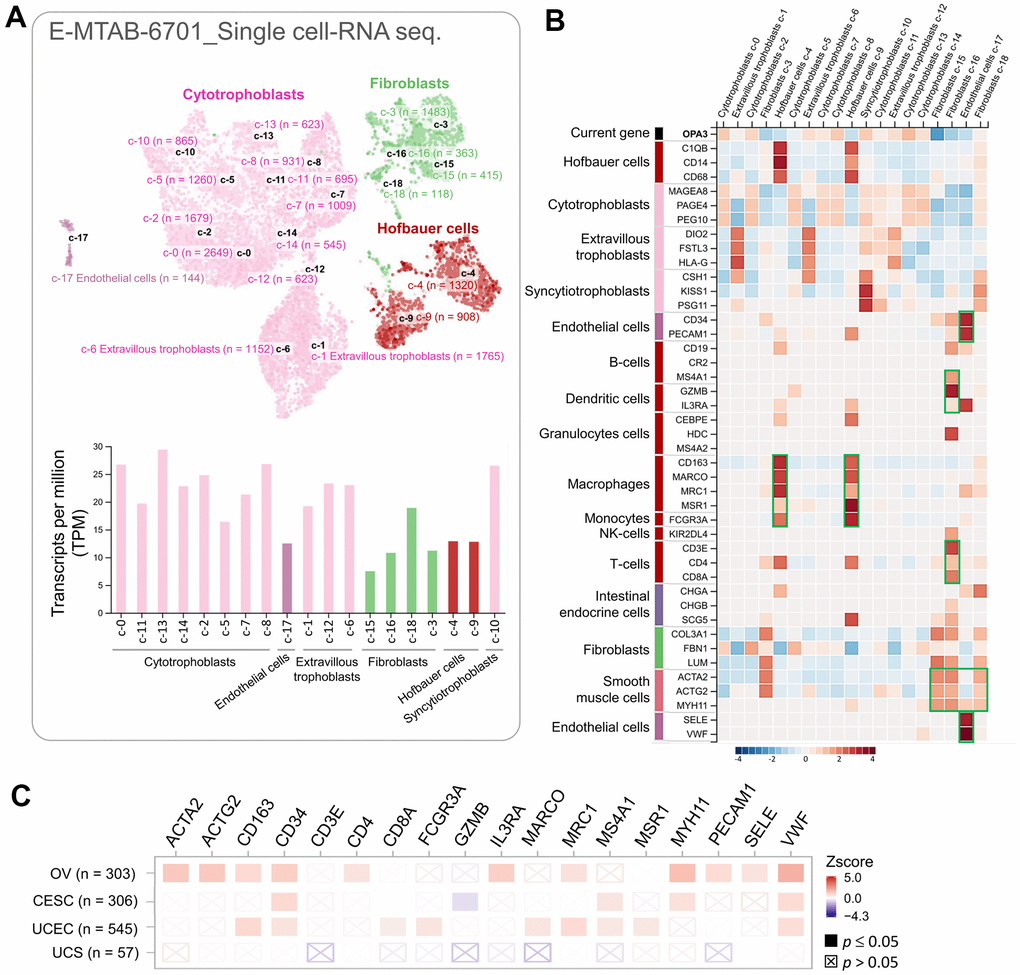
Figure 6.The correlation between OPA3 and immunization. (A) Single cell-RNA sequencing in identified single cell type clusters in placental tissue as shown by UMAP plots and bar graphs. (B) Heatmap showing the expression of OPA3 gene and well-known cell type markers in different single cell type clusters of the tissue. (C) Relationship between immune cell infiltration and OPA3 expression.