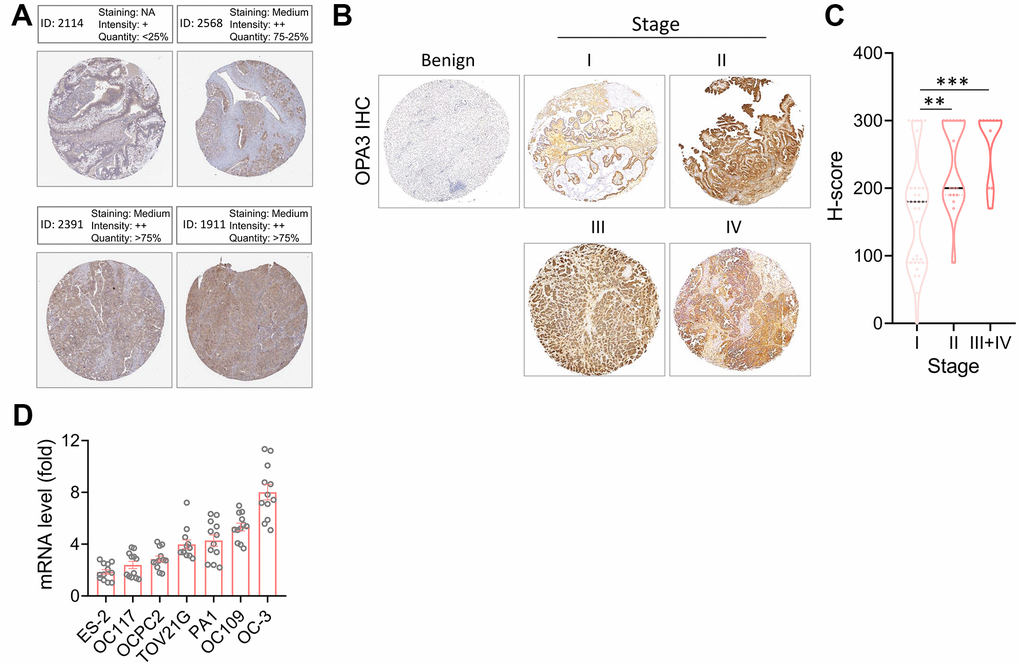
Figure 4.Protein levels of OPA3 in ovarian carcinoma. (A) Representative images of OPA3 IHC staining in ovarian cancer from the human Protein Atlas dataset. (B) Representative images of OPA3 expression at different stages of OV. (C) Violin plots of OPA3 expression levels OV in different stages. (D) RT-PCR was used to detect the expression levels of different ovarian cancer cells. ** p < 0.01., *** p < 0.001 Scale bar = 500 μm.