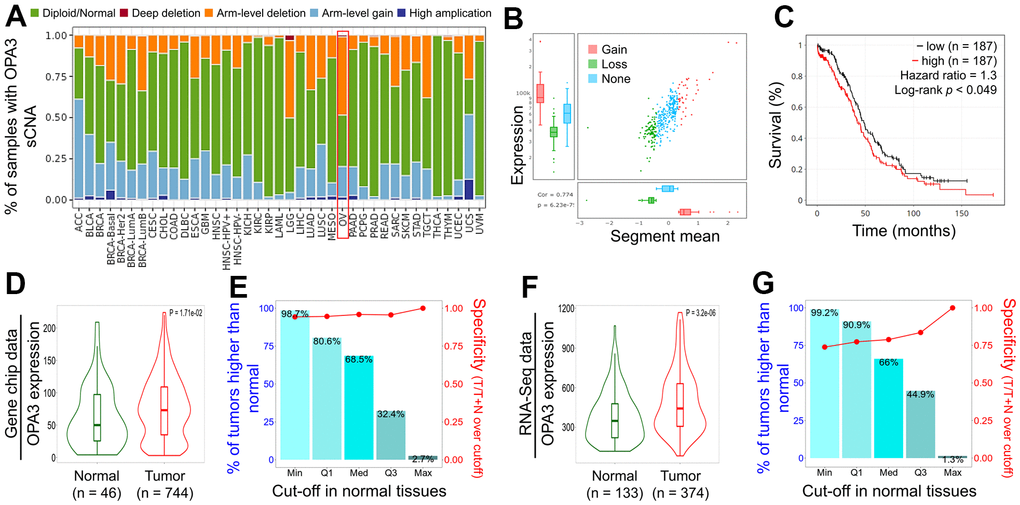
Figure 3.Relative expression and survival of OPA3 in OV tissues based on multiple databases. (A) Illustration of the definition of somatic cell copy alteration (SCNA) at the OPA3 gene level.(B) Distribution and correlation of CNV in ovarian cancer are marked in red (gain) and green (loss) to visualize the distribution of log2 ratios. (C) Overall survival estimates of OPA3 mRNA levels from the Kaplan-Meier Mapper database. Violin plots (D, F) and box plots (E, G) of OPA3 gene expression from RNA sequencing data and gene microarray data.