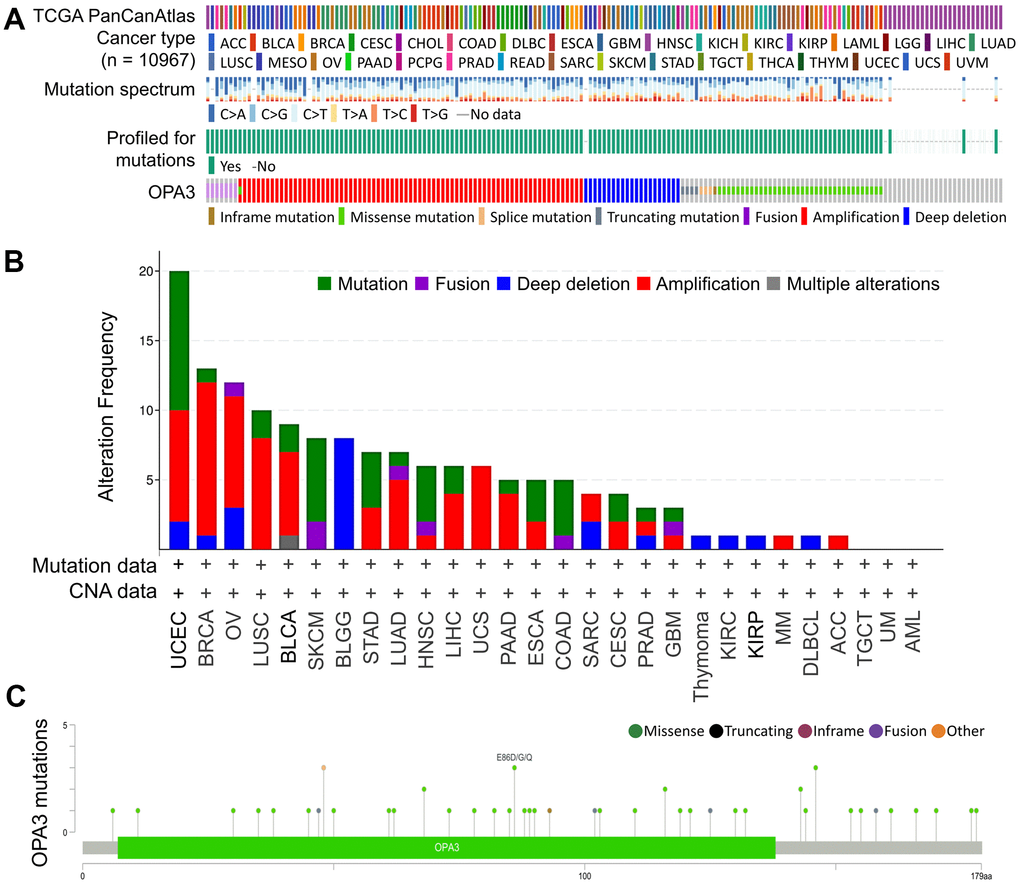
Figure 2.Analysis of OPA3-related transcription factor variants in ovarian cancer. (A) Frequency and type of OPA3 gene mutations in pancancer. (B) Distribution of copy number mutations of pan-oncogenes from TCGA. (C) OPA3 protein structural domain and location of specific mutations. The length of the line linking the mutation annotation to the protein indicates the number of samples with mutations.