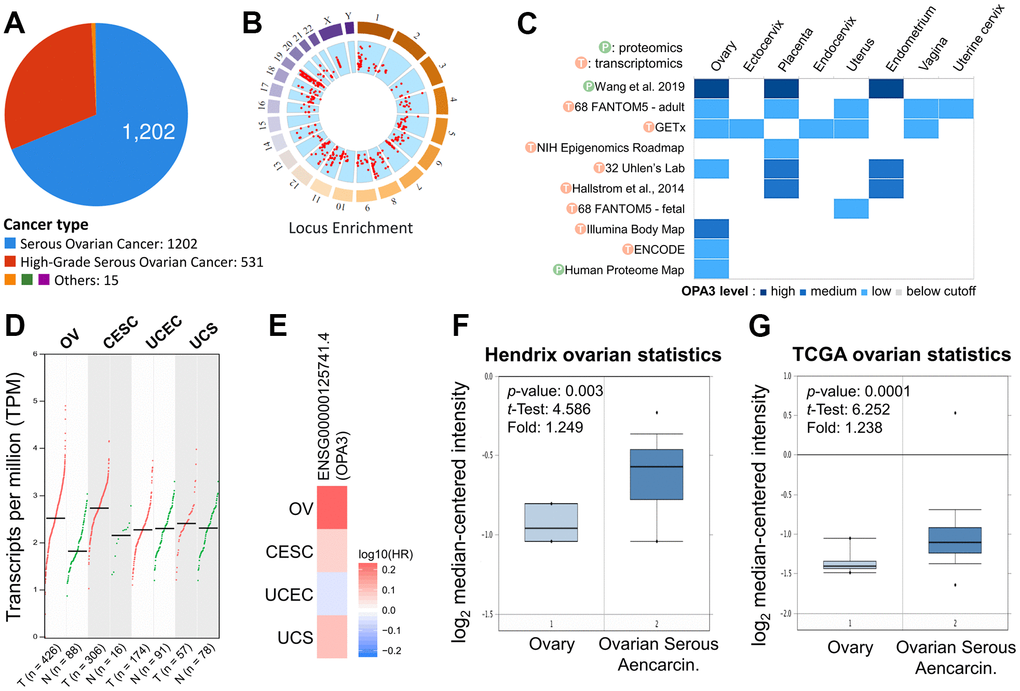
Figure 1.Expression analysis with OPA3 in the reproductive system. (A) Percentage of each ovarian cancer type in the TCGA dataset from cBioPortal. (B) Percentage of mutation counts and genomic changes due to copy number changes for different ovarian cancer types in the TCGA dataset. (C) RNA and protein levels of OPA3 in the reproductive system in the GETx database. (D, E) Gene transcriptional expression and survival of OPA3 in the female reproductive system. (F, G) Box plots of OPA3 mRNA levels in OV and normal tissues from Hendrix and TCGA ovarian Statistics.