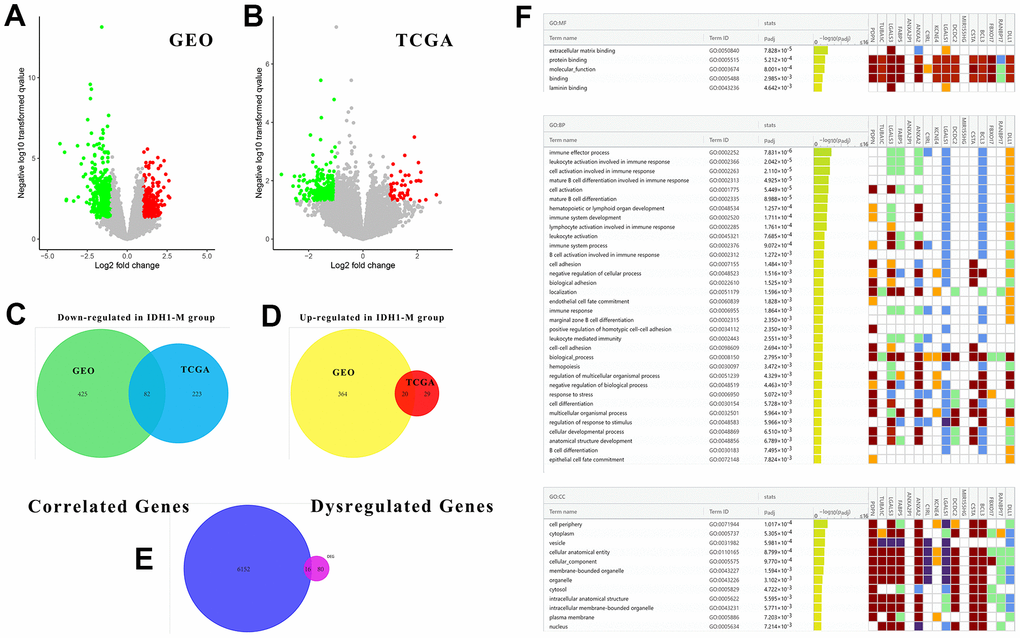
Figure 3.The associated DEGs with IDH1 and enrichment analysis. (A, B) The volcano plots show all DEGs from GEO and TCGA databases, respectively. The red points represent up-regulated genes while the green ones represent down-regulated genes. The gray points represent genes with no significant difference. (C, D) The Venn diagrams show the up-regulated and down-regulated genes both in GEO and TCGA databases. (E) A Venn diagram shows the genes both associated with IDH1 and deregulated by IDH1 mutation. (F) A lattice diagram shows the result of GO enrichment analysis of screened genes.