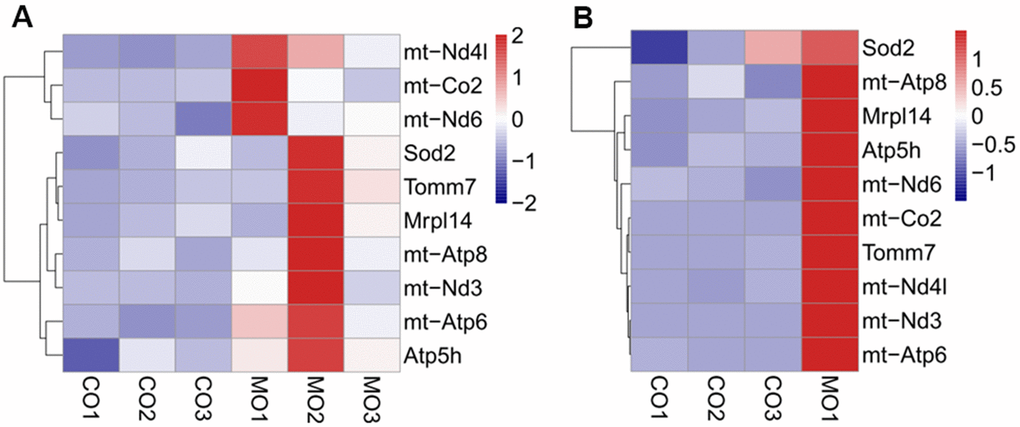
Figure 6.Heatmap showing the differential expression of mitochondrial related genes between MO-MenSCs vs. MO-control (A) and MO-MITO vs. MO-control samples (B).
Figure 6 — Menstrual blood-derived stem cells and its mitochondrial treatment improve the ovarian condition of aged mice | Aging