Submit an Article
Navigate
Home
Editorial Board
Editorial Policies
Current Volume
Archive
Scientific Integrity
Publication Ethics Statements
Interviews with Outstanding Authors
Newsroom
Sponsored Conferences
Podcast
Contact
Special Collections
Submit an Article
Online ISSN: 1945-4589
Research Paper
|
Volume 14, Issue 9
|
pp. 3826–3835
Menstrual blood-derived stem cells and its mitochondrial treatment improve the ovarian condition of aged mice
Back to article
Figure 1
(1 of 6)
−
100%
+
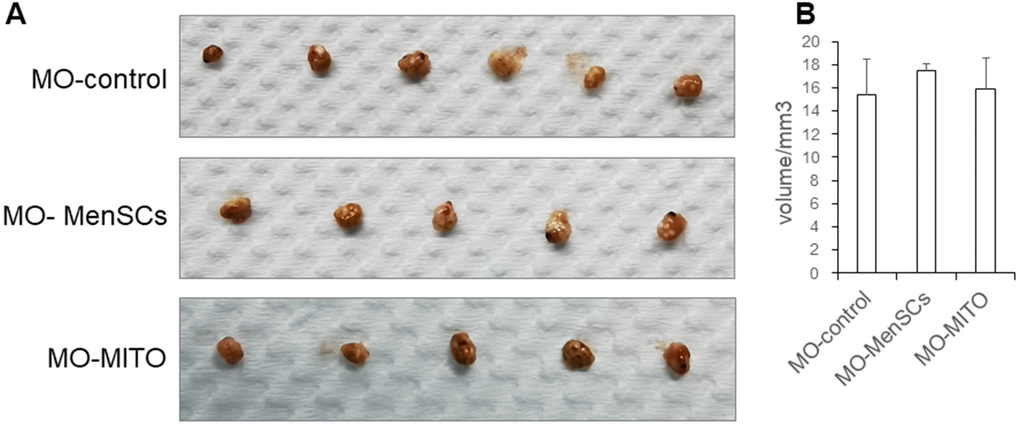
Figure 1.
Macroscopic ovarian sizes (
A
) and representative bar graph summarizing the ovarian volumes (
B
) in the three groups after seven days of treatment.