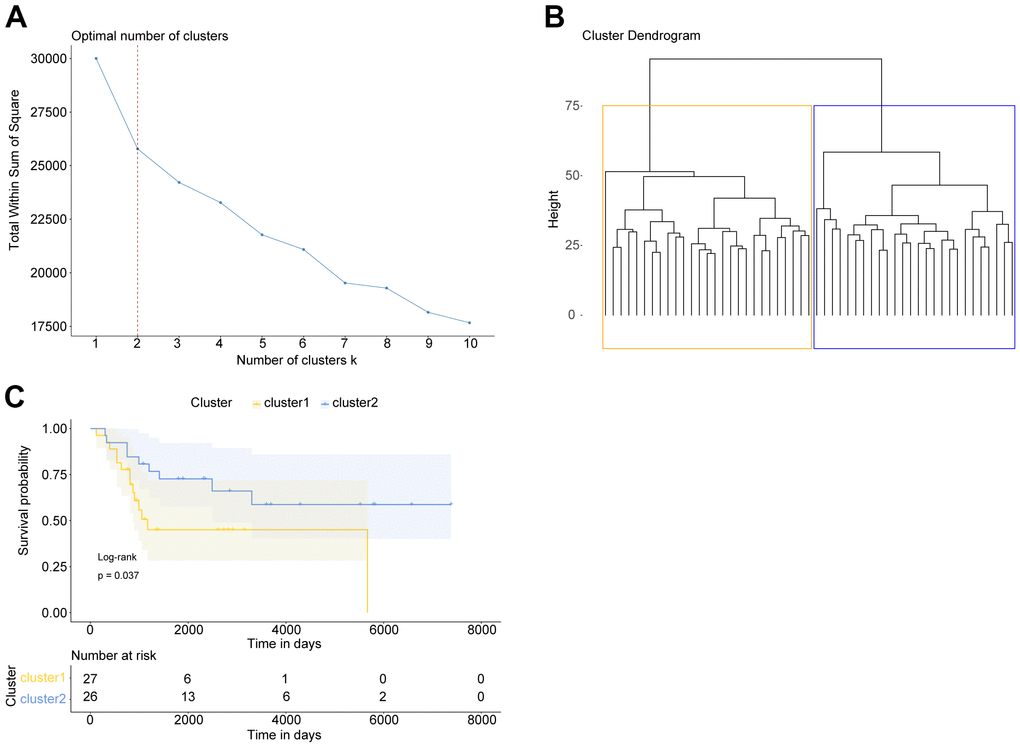
Figure 1.OS patients with different prognosis could be divided basing on apoptosis-related genes. (A) Elbow diagram indicated that the optimal number of clusters was k=2. (B) The cluster results of OS samples. (C) Kaplan Meier survival curve of OS patients in two clusters. P was calculated according to log-rank test.