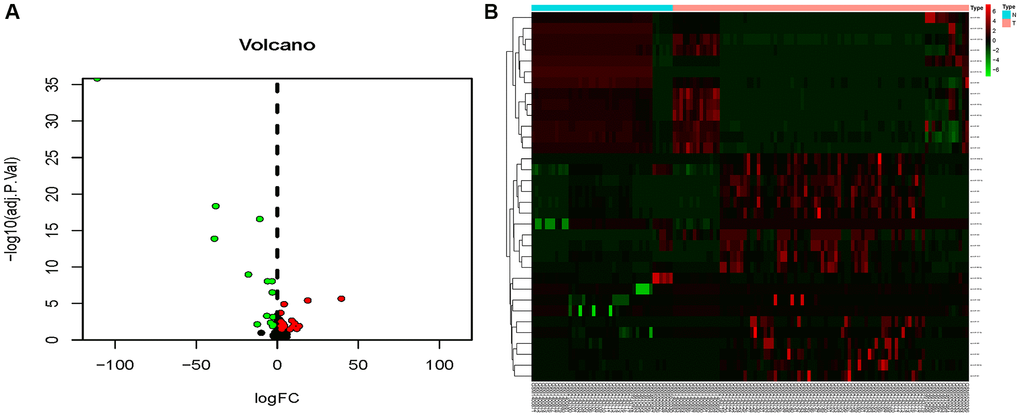
Figure 3.Volcano map and heat map of DE-miRNAs. (A) The volcano plot using log2|FC|≥2 and an adjusted p < 0.05 as cut off values for miRNAs; red dots represent upregulated DE-miRNAs (n = 15), blue dots represent downregulated DE-miRNAs (n = 12), and black dots represent non-DEmiRs. (B) A heat map depicting the expression variety of 34 DE-miRNAs across four miRNA chips; the color scale from blue to red represents expression levels ranging from low to high.