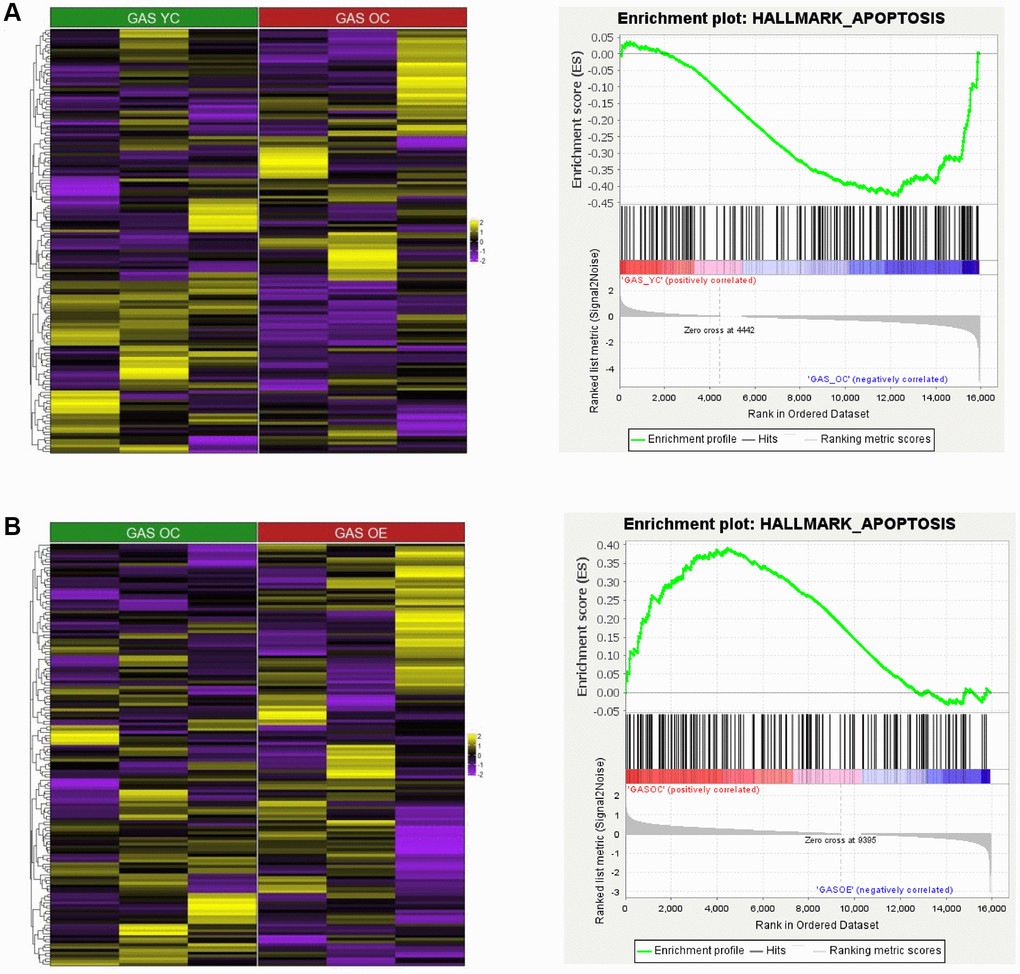
Figure 6.Heatmap and GSEA results for HALLMARK_APOPTOSIS in “YC vs. OC”, “YC vs. YE”, and “OC vs. OE” in SOL and GAS. The heatmap and enrichment plot in (A) GAS YC vs. GAS OC and (B) GAS OC vs. GAS OE. For the color of the heatmap, yellow indicates upregulated genes, and purple indicates downregulated genes. The significant GSEA results for gene sets other than HALLMARK_APOPTOSIS are listed in Tables 8–13.