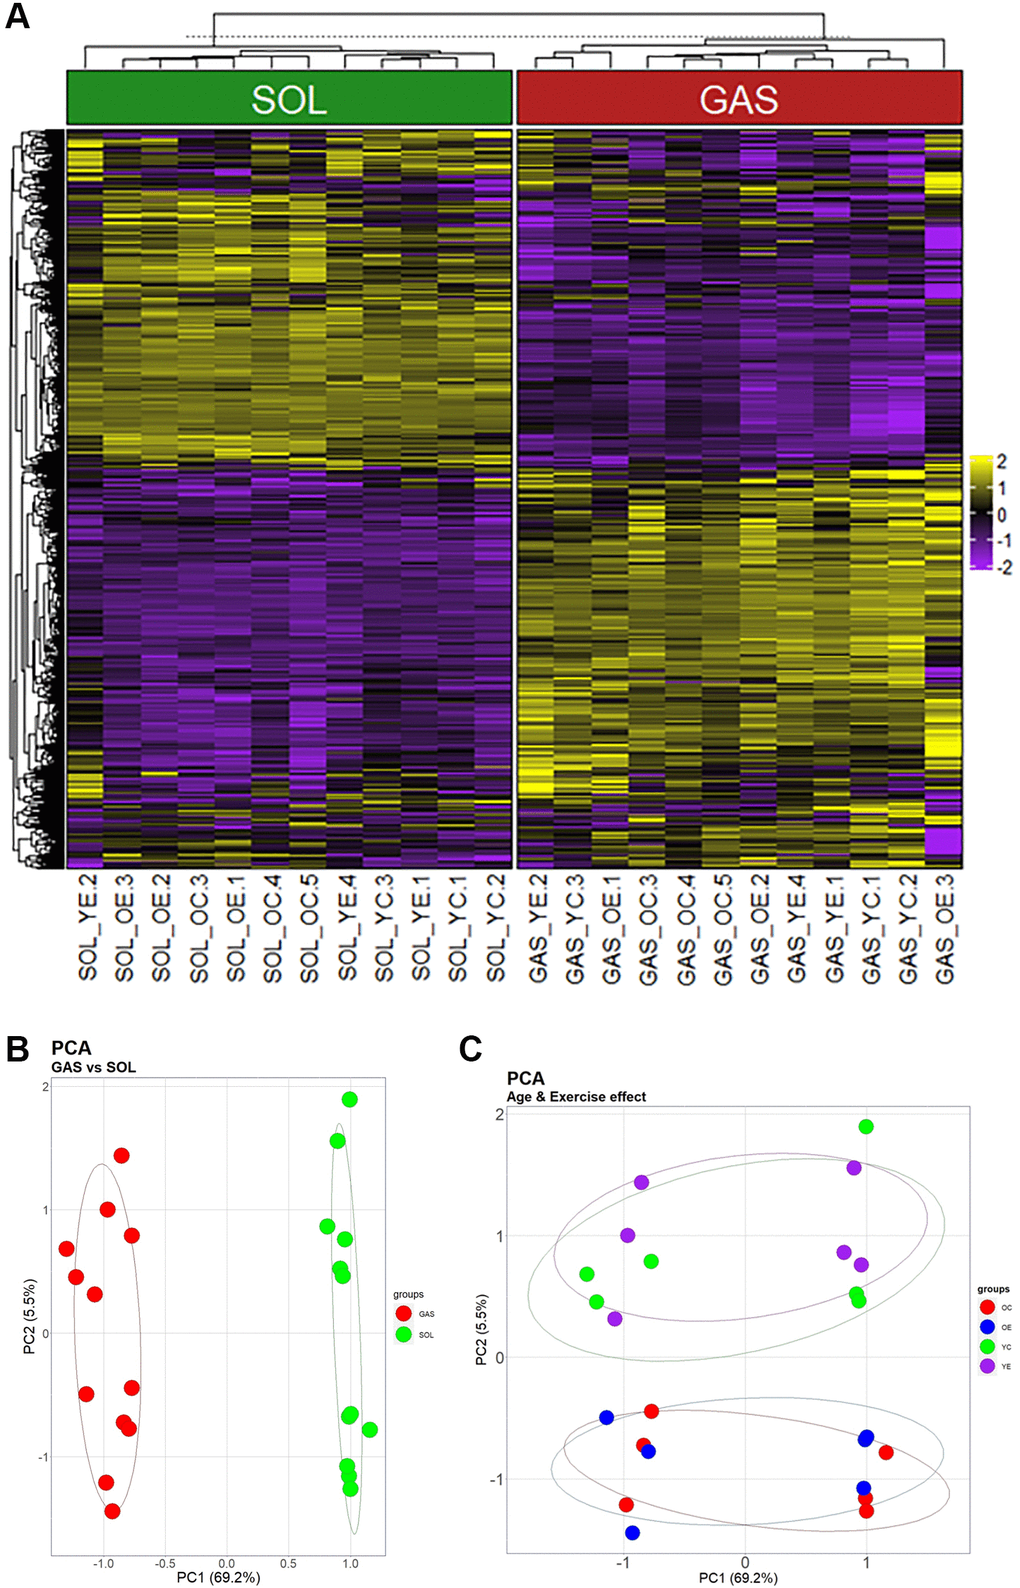
Figure 1.Heatmap and PCA showing the effects of muscle fiber type, aging, and exercise on gene expression. (A) Heatmap using the 1268 genes that passed screening. (i) Values for genes with median value of <5 and (ii) SD of bottom 25% were excluded. Yellow indicates high expression, and blue indicates low expression. (B) and (C) are the same plot, but they were clustered by another PC. (B) Clusters separated by PC1 (69.2% of total variance) (C) Groups divided by PC2 (5.5% of total variance).