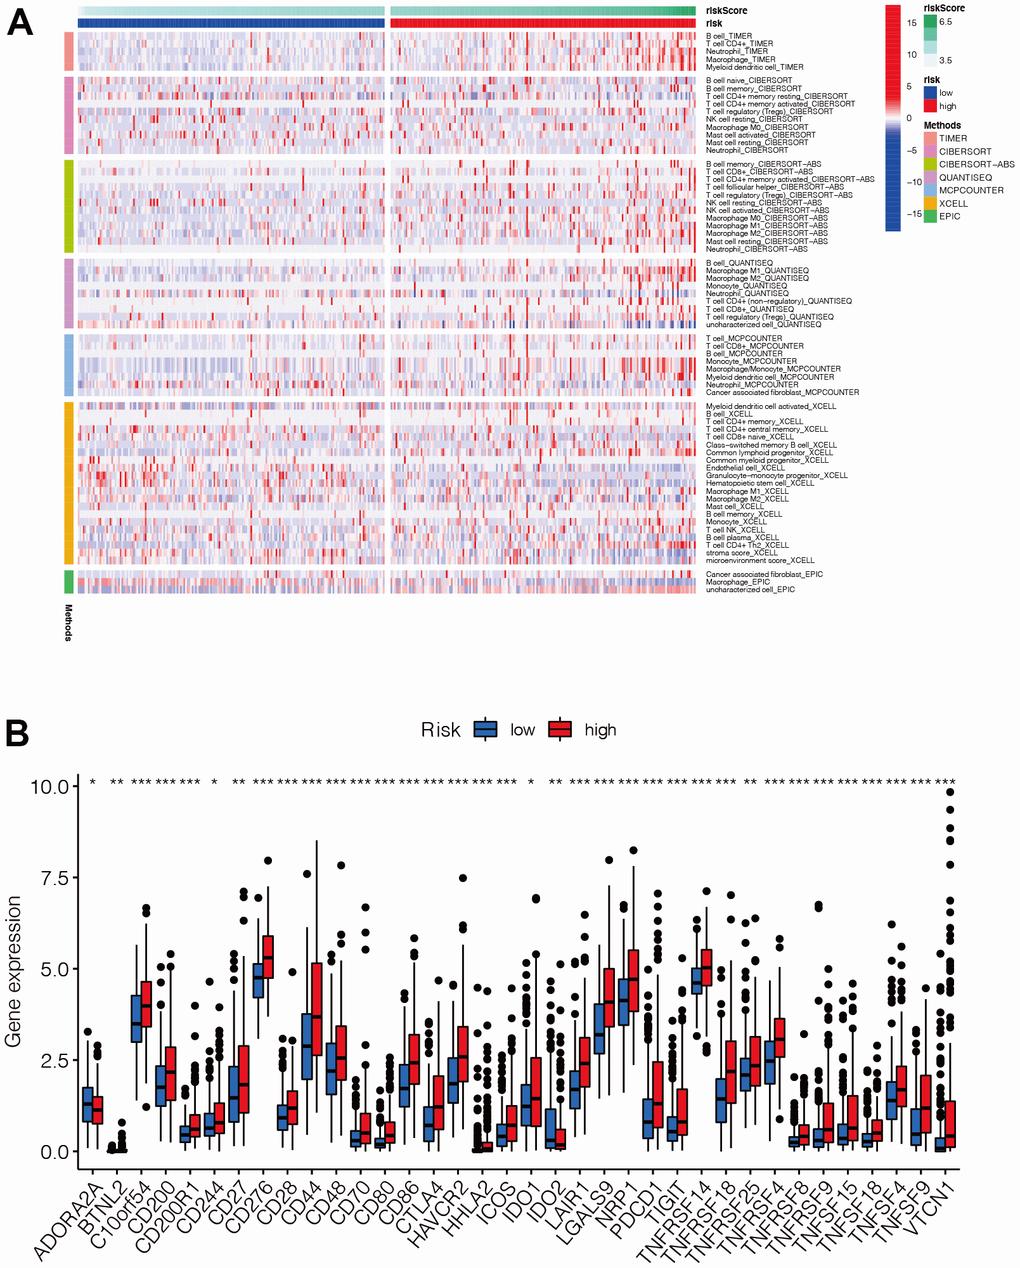
Figure 7.Analysis of immune infiltration and immune checkpoint. (A) The distribution of immune cells was significantly different between the high- and low-risk groups. In general, T cells and B cells tended to be highly expressed mainly in the high-risk group. (B) Most of the immune checkpoint genes were up-regulated in the high-risk group, suggesting that there may be differences in the immune microenvironment between the high- and low-risk groups.