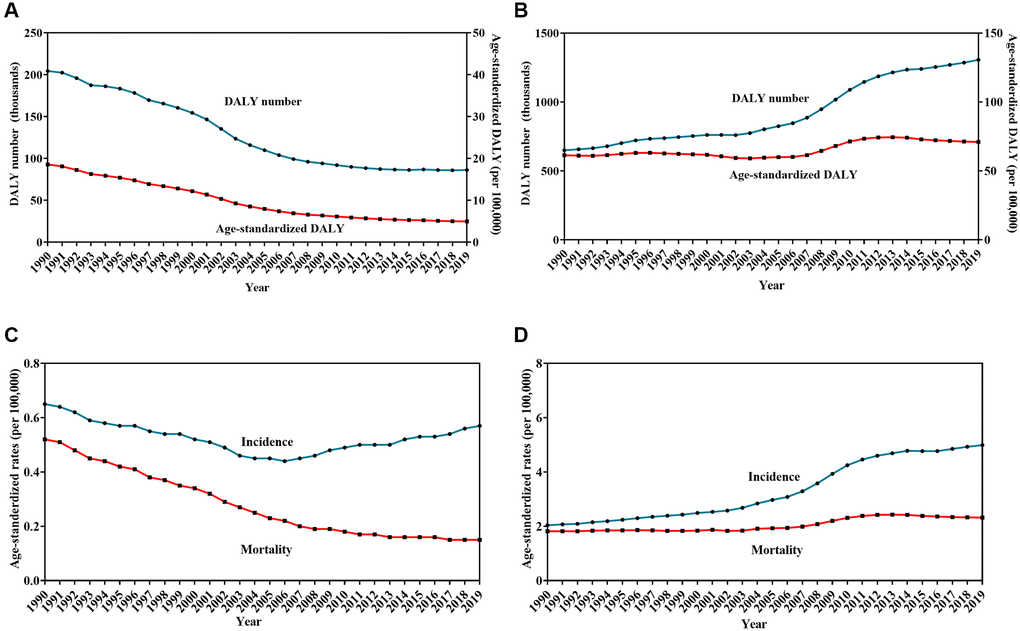
Figure 3.Trends in burden of Hodgkin lymphoma (HL) and non-Hodgkin lymphoma (NHL) from 1990 to 2019. Change in the number and age-standardized rates of disability-adjusted life years for HL (A) and NHL (B), Change in age-standardized incidence and mortality rates for HL (C) and NHL (D).