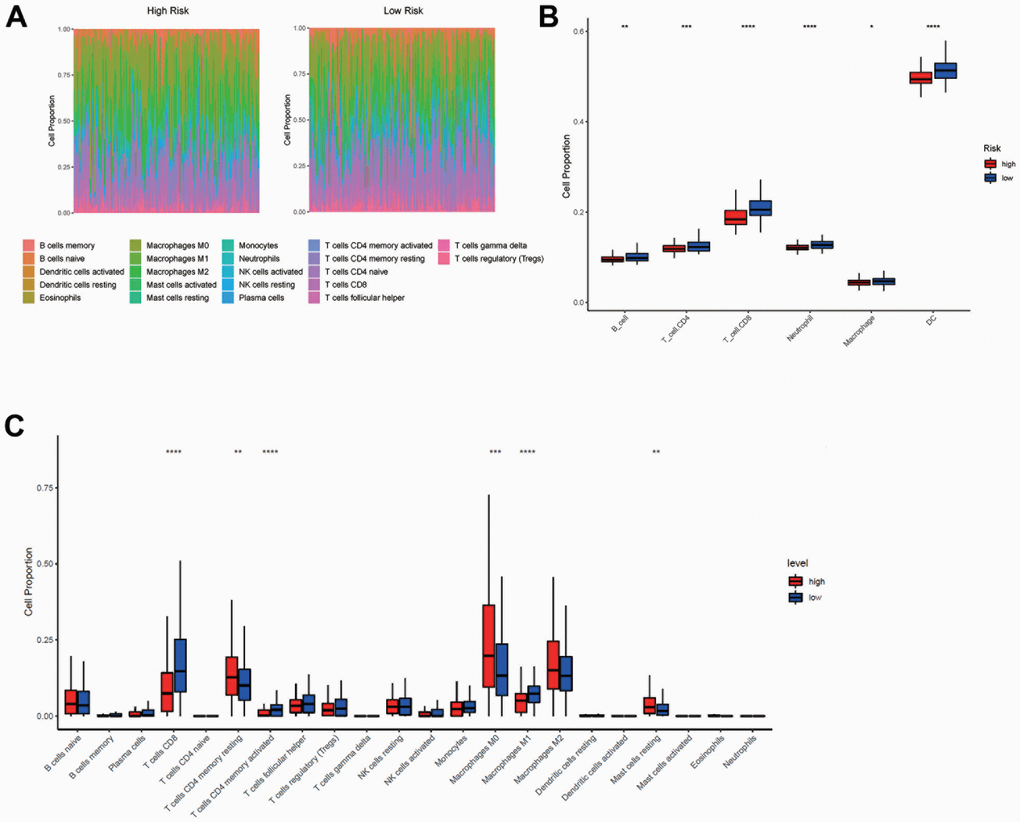
Figure 8.Immune cell infiltration analysis between high- and low-risk group. (A, C) The proportions of 22 immune cells infiltrated in the high- and low-risk groups from CIBERSORT analysis. (B) The proportions of B cells, CD8+ T cells, CD4+ T cells, neutrophils, macrophages, and dendritic cells infiltrated in the high- and low-risk groups from TIMER analysis. The horizontal axis of Figure B, C was the immune cells, and the vertical axis was the cell infiltration proportion. High-risk and low-risk groups were marked in red and blue, respectively.