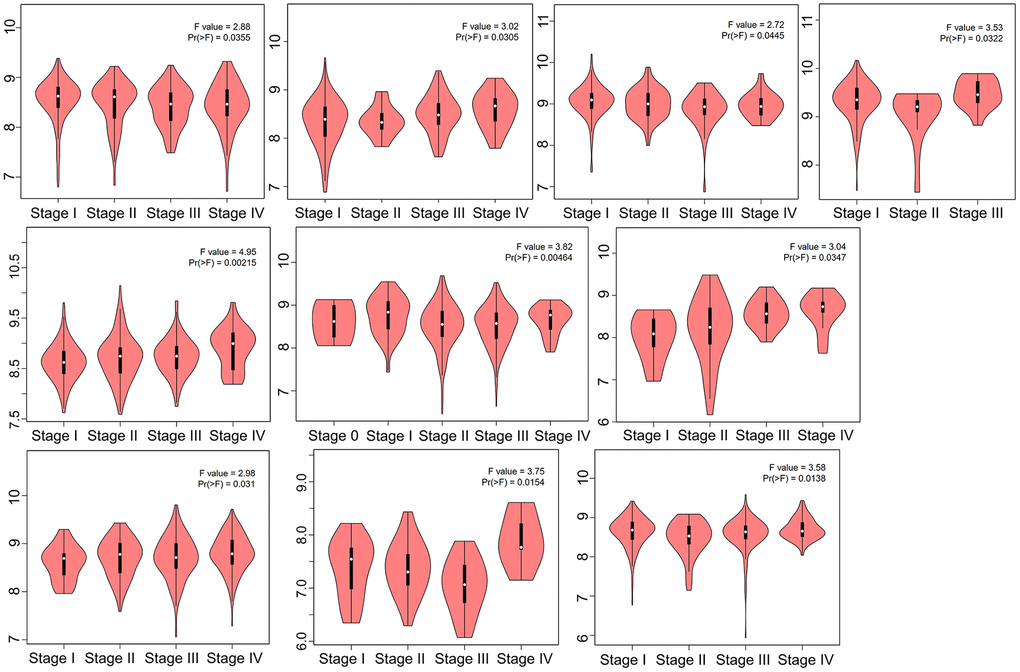
Figure 2.HNRNPC expression in different clinical stage. TCGA data were used to examine the expression level of the HNRNPC gene during the major pathogenic phases. For log-scale, Log2 (TPM+1) was used.
Figure 2 — A systematic pan-cancer study demonstrates the oncogenic function of heterogeneous nuclear ribonucleoprotein C | Aging