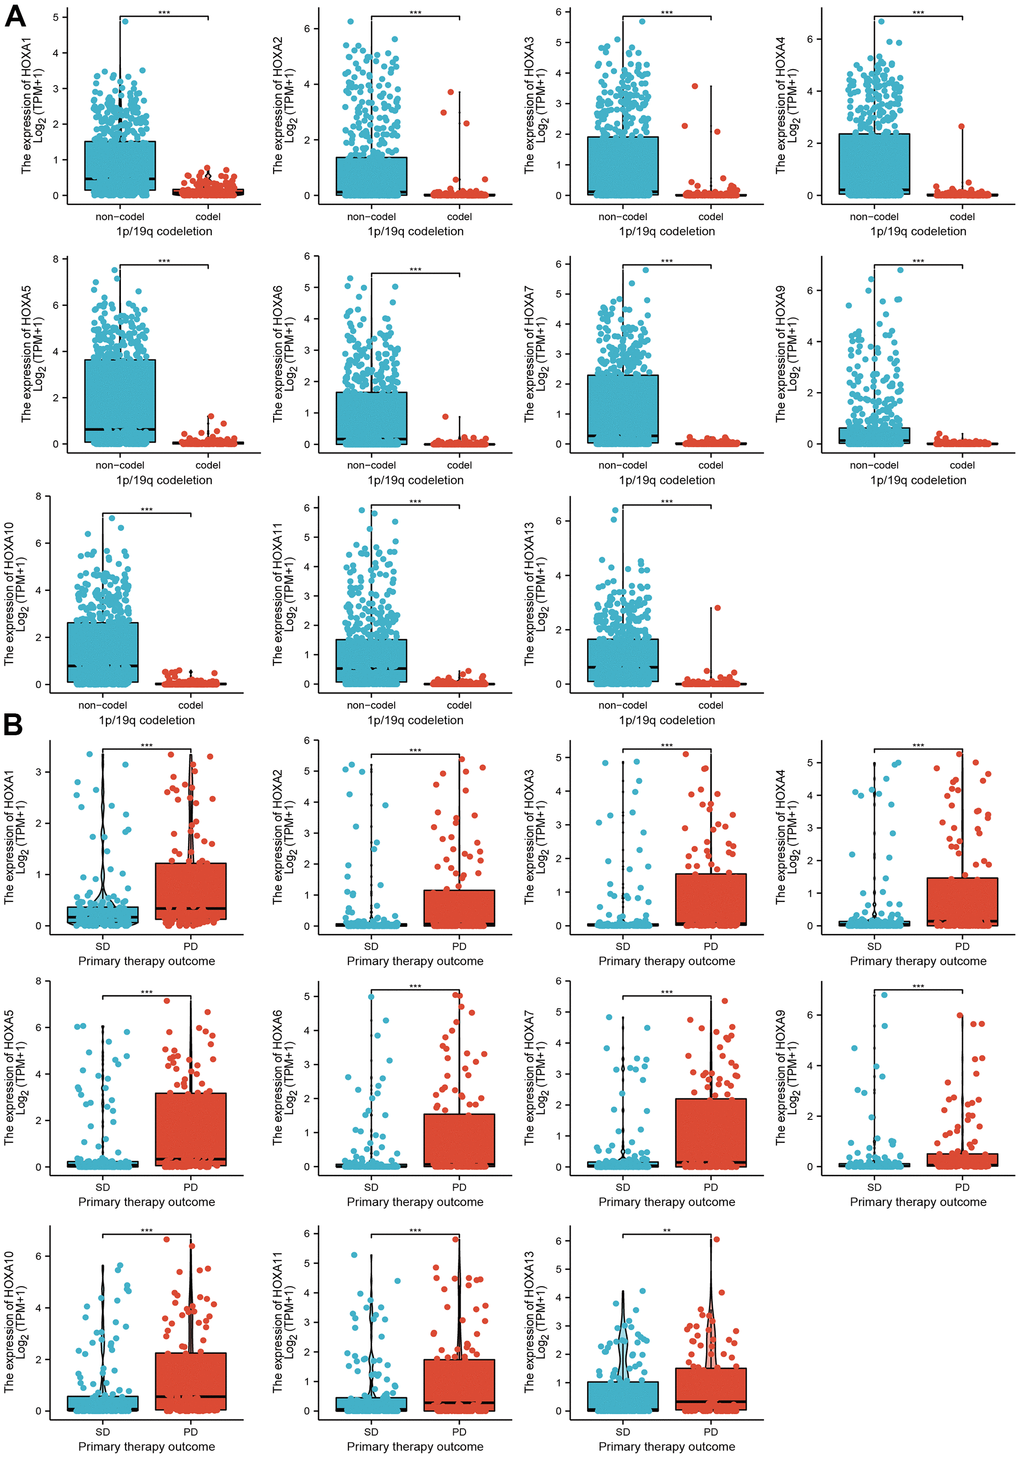
Figure 3.The correlation between HOXAs expression and clinical information in LGG. (A, B) The correlation between HOXAs expression and clinical features, including the 1p/19q codeletion and primary therapy outcome in glioma based on TCGA-LGG. *p < 0.05, **p < 0.01, ***p < 0.001.