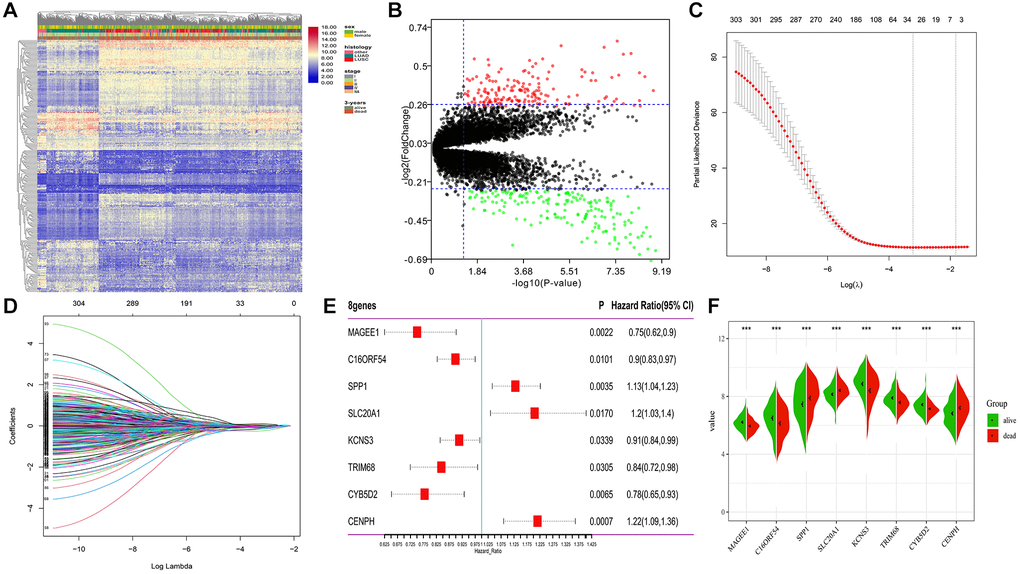
Figure 2.Differential expression and LASSO-Cox regression results of DEGs. (A, B) Heatmap plot and volcano plot represents the expression of 306 DEGs between samples from alive and deceased patients based on 3-year survival data, satisfying the criteria of adjusted p-value < 0.05, |log2FoldChange| >0.26. (C, D) 26 genes considered the more correlated with prognosis were identified by LASSO regression method. (E) Coefficients of eight genes estimated by multivariate Cox regression. (F) Expression profiles of eight hub genes between samples from alive and deceased patients with 3-year survival data.