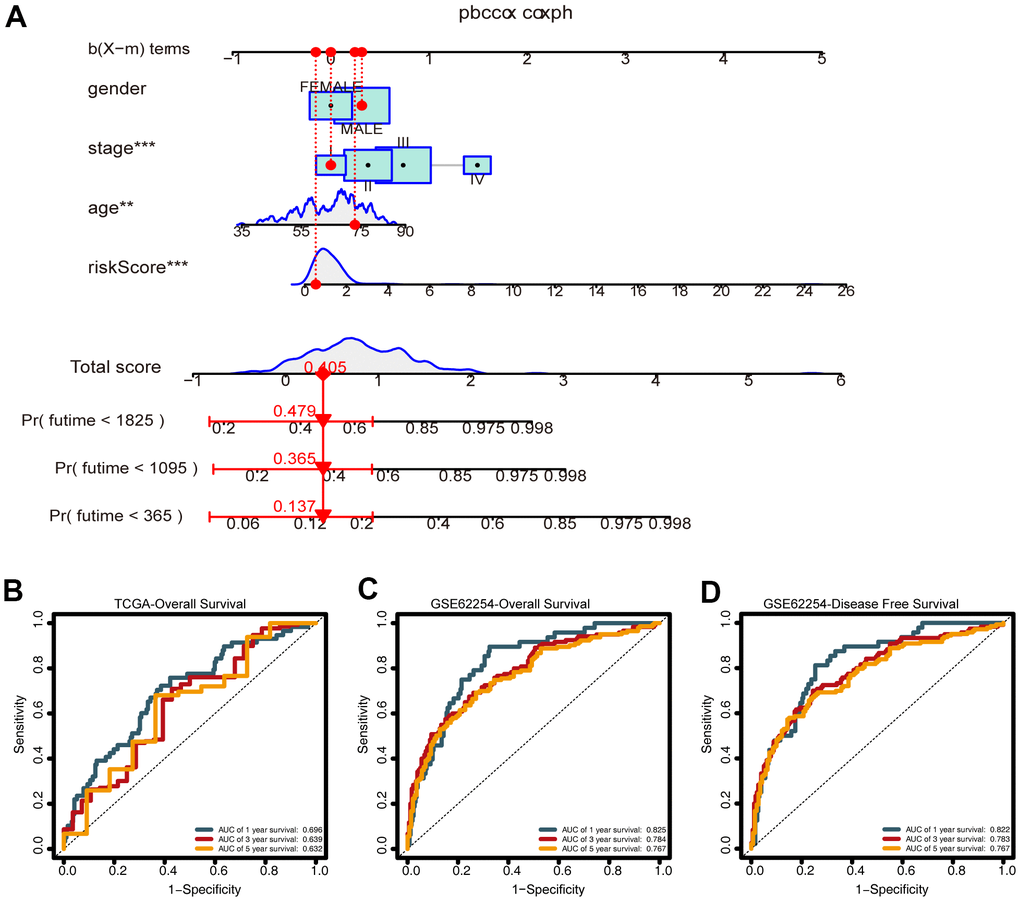
Figure 8.Construction of the nomogram. (A) A nomogram for predicting one-, three-, and five-year overall survival (OS) generated by integrating the risk score, age, gender, and stage. (B) Time-dependent receiver operating characteristic ROC curves of the nomogram for OS prediction from the training set. (C) Time-dependent ROC curves of the nomogram for OS prediction from the validation set. (D) Time-dependent ROC curves of the nomogram for DFS predictions from the validation set.