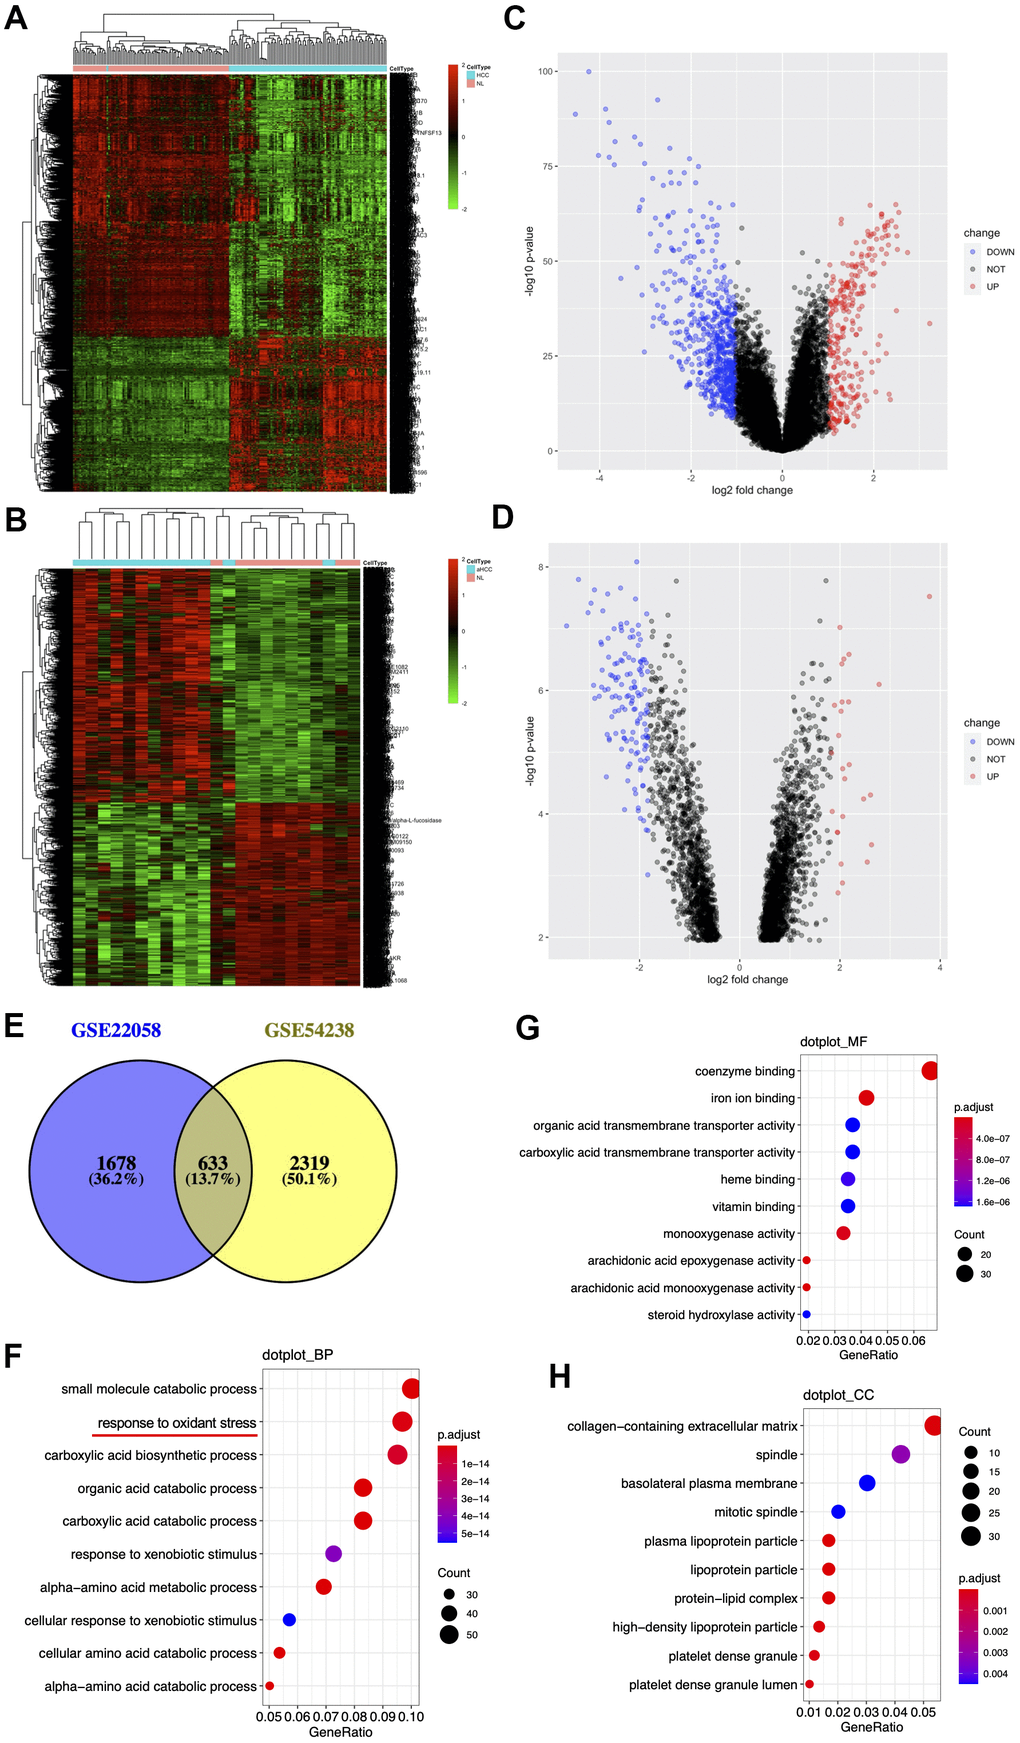
Figure 1.Identification and enrichment of DEGs from the GSE54238 and GSE22058 datasets. (A, B) DEGs hierarchical clustering. Data are the log2 HCC-to-normal intensity ratio. Green and red represent significantly downregulated and upregulated genes (p <0.05), respectively. aHCC, advanced hepatocellular carcinoma. (C, D) Volcano plot representing the distribution of DEGs. (E) DEGs shared in two datasets. (F–H) Ten significant GO terms.