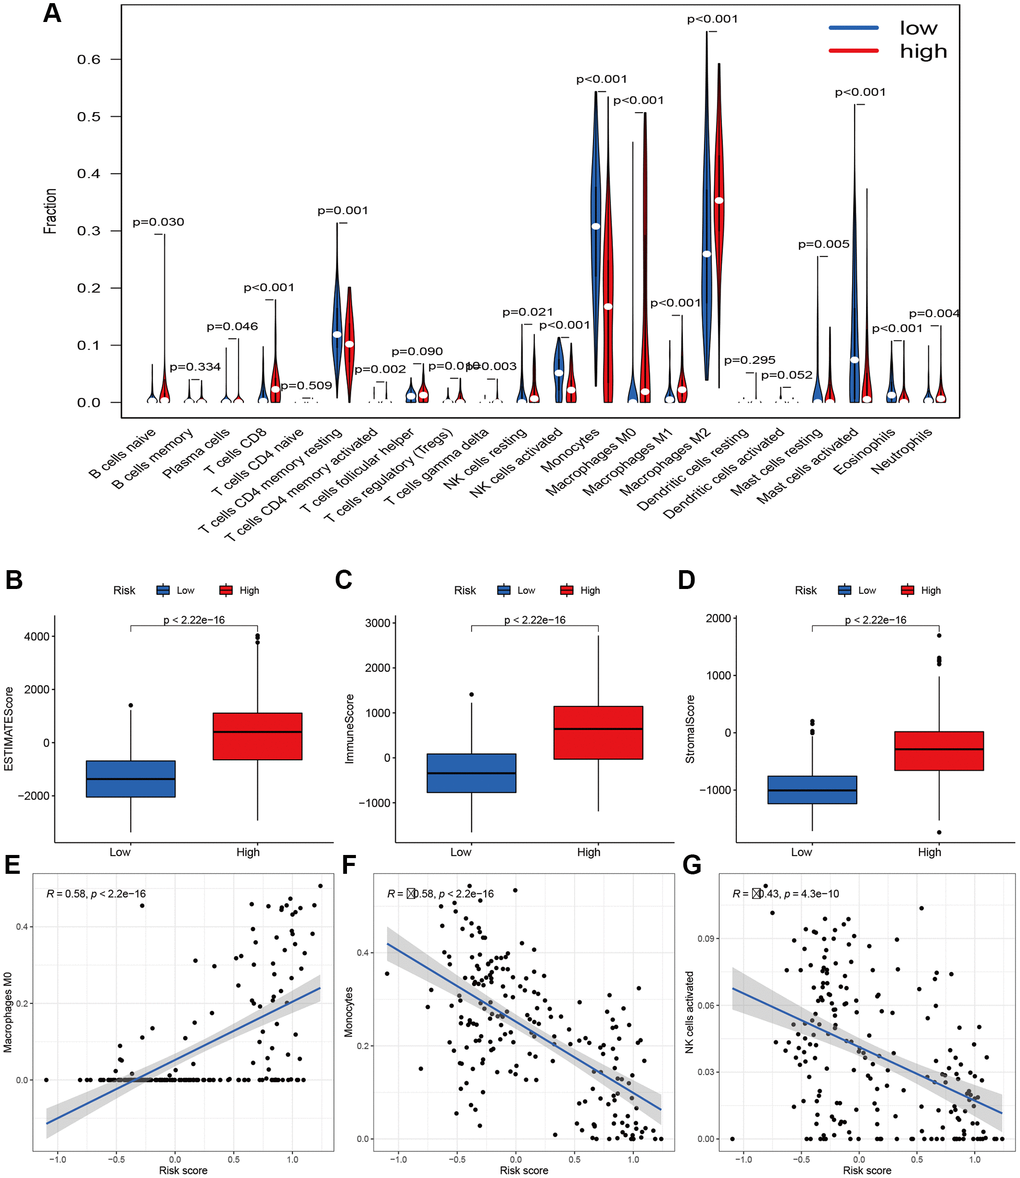
Figure 8.Immune filtration analysis between high- and low-risk groups. (A) Differential analysis of immune-related cells based on risk score. (B–D) Boxplot showed the comparisons of Estimation, immune and stromal score between high- and low-risk groups. (E–G) Scatter plot showed that the correlations of risk score with Macrophages M0, Monocytes, and NK cells activated