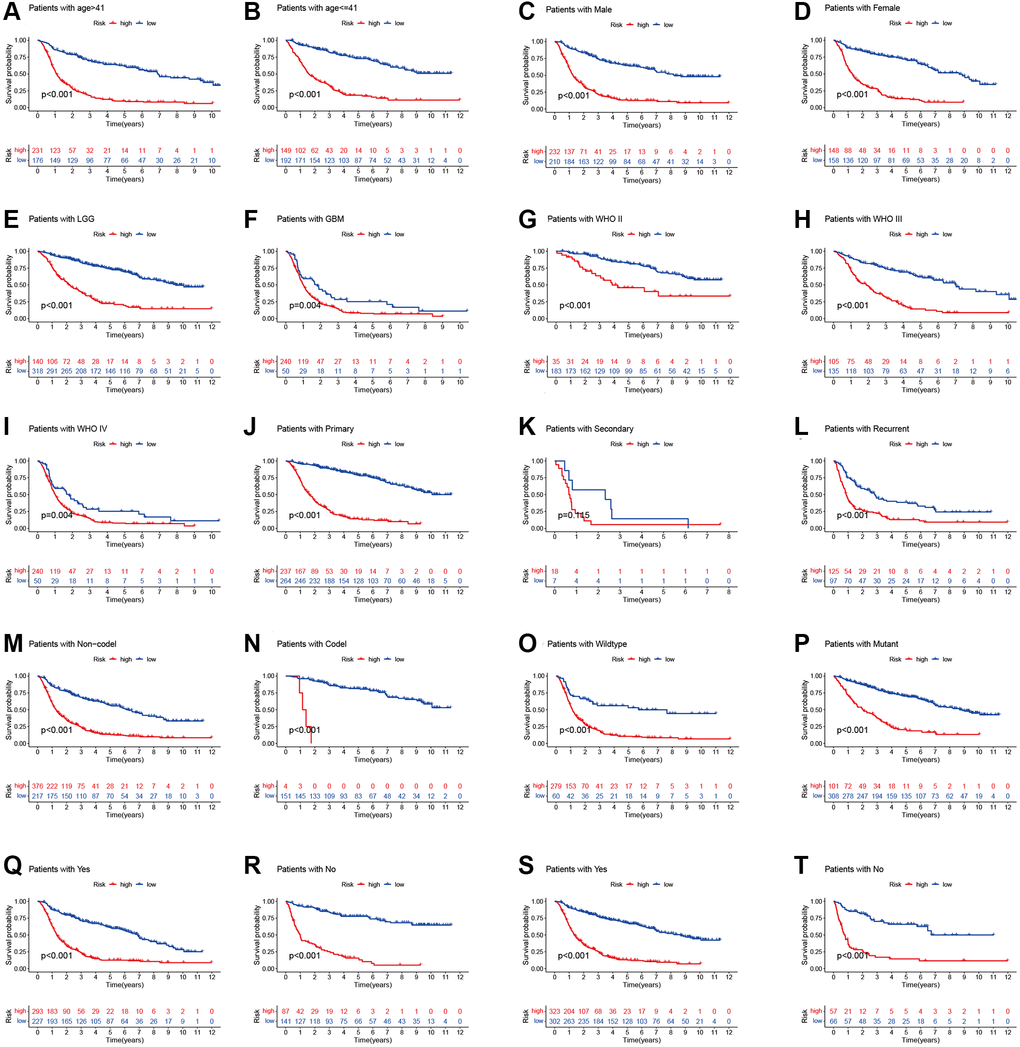
Figure 4.Stratified analyses of high- and low-risk group. (A and B) age. (C and D) Gender. (E and F) Histology. (G–I) WHO stage. (J–L) Pathology type. (M and N) 1p19q codeletion status. (O and P) IDH mutation status. (Q and R) Chemotherapy. (S and T) Radiotherapy.