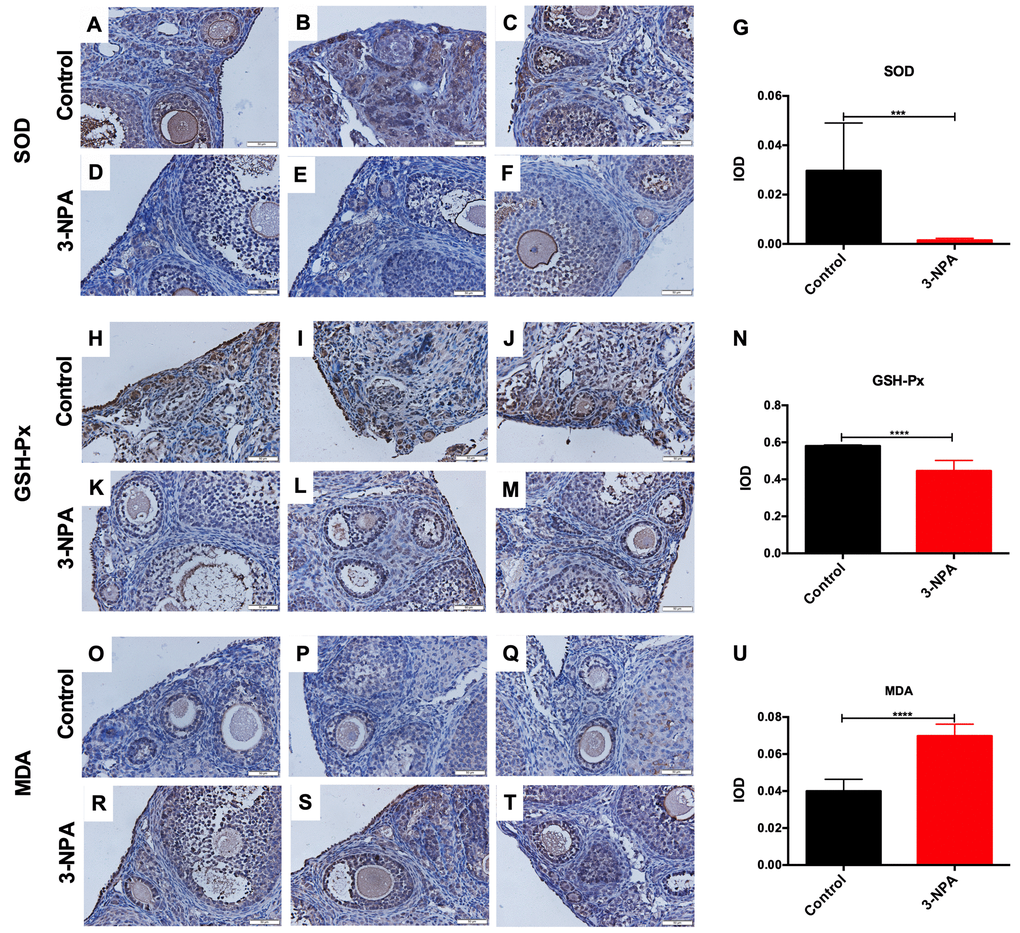
Figure 3.Comparison of ovarian oxidative stress-related changes between the control and 3-NPA groups. (A–U) SOD expression was lower (A–G), GSH-Px expression was lower (H–N), and MDA expression was higher (O–U) in GCs from 3-NPA mice than in those from control mice (Triplicates slides in each group, N=8 in all assays; *P<0.05, **P<0.01, ***P<0.001, ****P<0.0001).