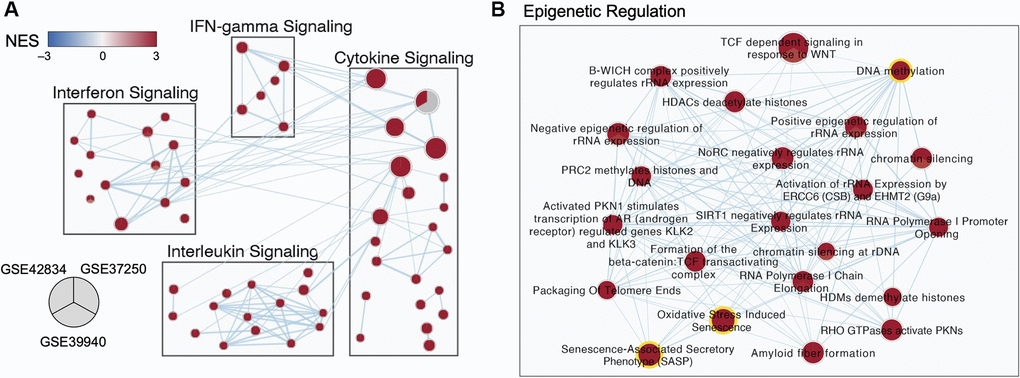
Figure 3.Multi-cohort transcriptomic analyses corroborated a role for epigenetic regulation in TB. (A) Selected subnetworks of enriched pathways associated with active TB diagnosis from three transcriptomic datasets. (B) Zoom-in of the Epigenetic Regulation Subcluster. Each node in the network represents an annotated gene set. Each node is a pie-chart corresponding to the normalized enrichment score (NES) for each dataset. Only nodes with a false discovery rate (FDR) q-value <0.01 in at least one dataset are depicted. Edges represent the overlap of genes between gene sets, where only overlaps >0.55 are visualized. The color of each pie on the map indicates the NES (blue for negative NES, and red for positive NES). The size of each node is proportional to the size of the gene sets.