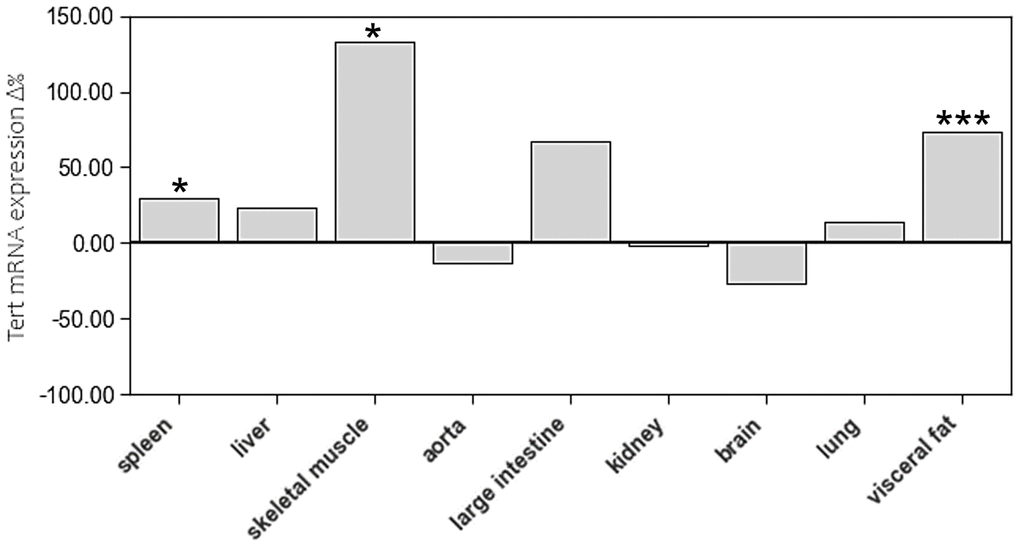
Figure 5.The impact of age on Tert mRNA expression of different tissue types. The boxes represent the delta% variation of Tert mRNA expression in adults compared to young. *p < 0.05; ***p < 0.001 vs. young.
Figure 5 — Telomere length in leucocytes and solid tissues of young and aged rats | Aging