Submit an Article
Navigate
Home
Editorial Board
Editorial Policies
Current Volume
Archive
Scientific Integrity
Publication Ethics Statements
Interviews with Outstanding Authors
Newsroom
Sponsored Conferences
Podcast
Contact
Special Collections
Submit an Article
Online ISSN: 1945-4589
Research Paper
|
Volume 14, Issue 4
|
pp. 1713–1728
Telomere length in leucocytes and solid tissues of young and aged rats
Back to article
Figure 2
(2 of 7)
−
100%
+
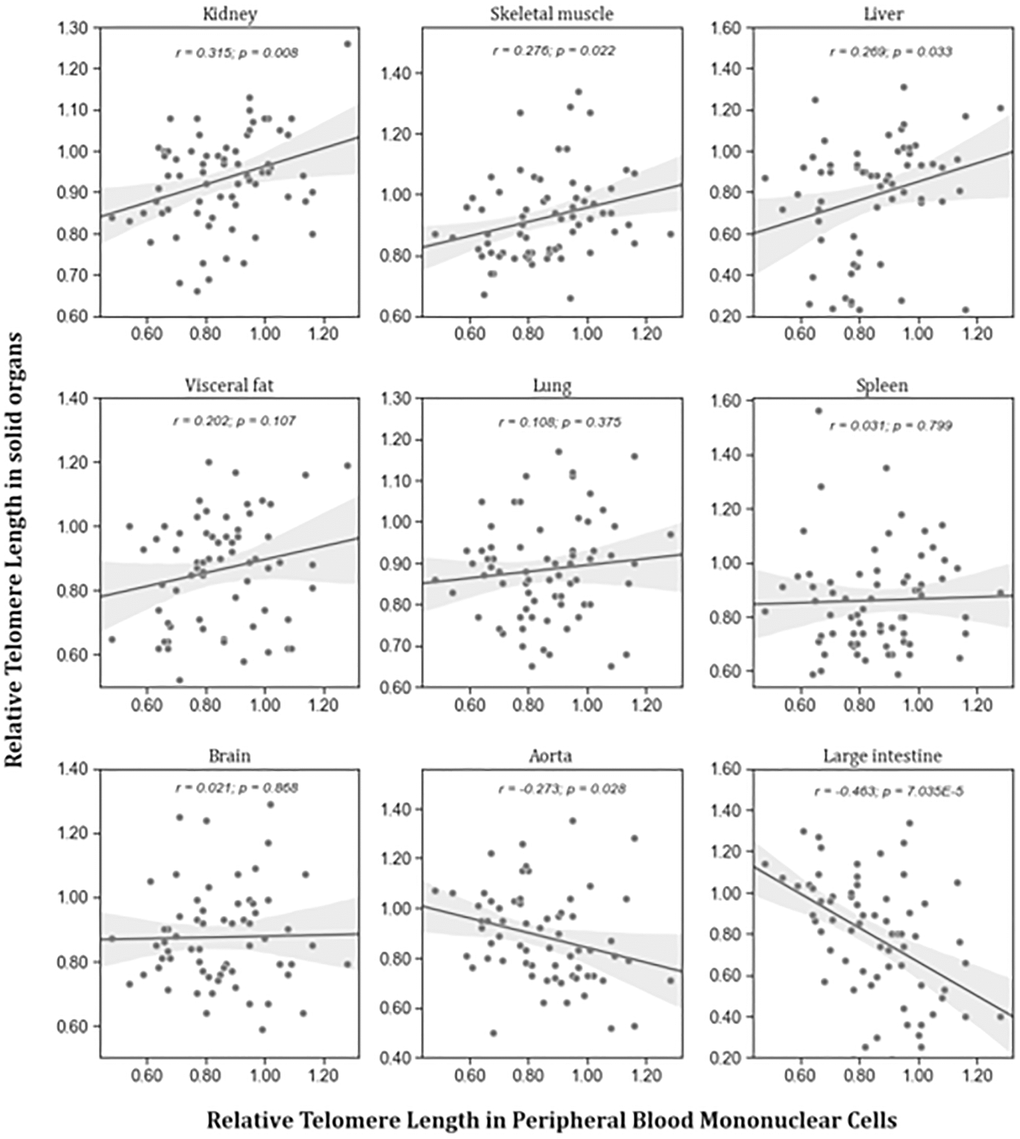
Figure 2.
Correlation between RTL in PBMCs and RTL in different organs isolated from adult rats (
n
= 72).
r – Pearson correlation coefficient,
p
–
p
value. The figure also shows in grey the regression line and 95% confidence interval.