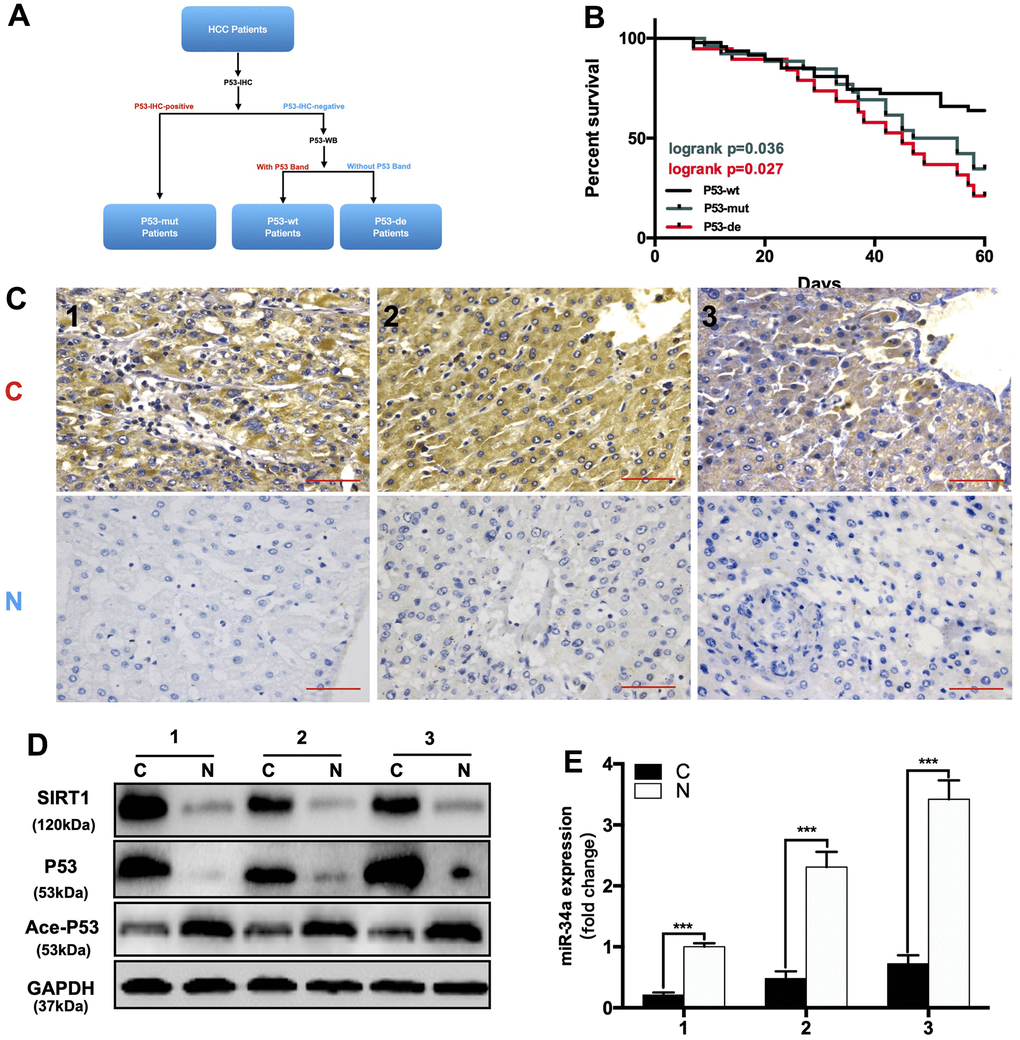
Figure 6.The expression of the P53/miR-34a/SIRT1 positive feedback loop in hepatocellular carcinoma patients. (A) A brief diagram of how 92 HCC patients were divided. (B) The 5-year survival rate of HCC patients from different groups. (p = 0.036, Green: P53-mutated vs P53-wild-type patients. p = 0.027, Red: P53-deficient vs P53-wild-type patients, log-rank test). (C) Representative images of P53 staining in P53-mutated patients. (D) Protein expression of the P53/miR-34a/SIRT1 positive feedback loop in P53-mutated patient tumor tissue. (E) Quantification of hepatic miR-34a expression in P53-mutated patient tumor tissue.
(F) Representative images of P53 staining in P53-wild-type patients. (G) Protein expression of the P53/miR-34a/SIRT1 positive feedback loop in P53-wild-type patient tumor tissue. (H) Quantification of hepatic miR-34a expression in P53-wild-type patient tumor tissue. (I) Representative images of P53 staining in P53-deficient patients. (J) Protein expression of the P53/miR-34a/SIRT1 positive feedback loop in P53-deficient patient tumor tissue. (K) Quantification of hepatic miR-34a expression in P53-deficient patient tumor tissue. C: liver cancer tissue N: adjacent normal liver tissue (***, p<0.001).