Submit an Article
Navigate
Home
Editorial Board
Editorial Policies
Current Volume
Archive
Scientific Integrity
Publication Ethics Statements
Interviews with Outstanding Authors
Newsroom
Sponsored Conferences
Podcast
Contact
Special Collections
Submit an Article
Online ISSN: 1945-4589
Research Paper
|
Volume 14, Issue 4
|
pp. 1959–1982
Comparison of one-week versus three-week paclitaxel for advanced pan-carcinomas: systematic review and meta-analysis
Back to article
Figure 5
(5 of 8)
−
100%
+
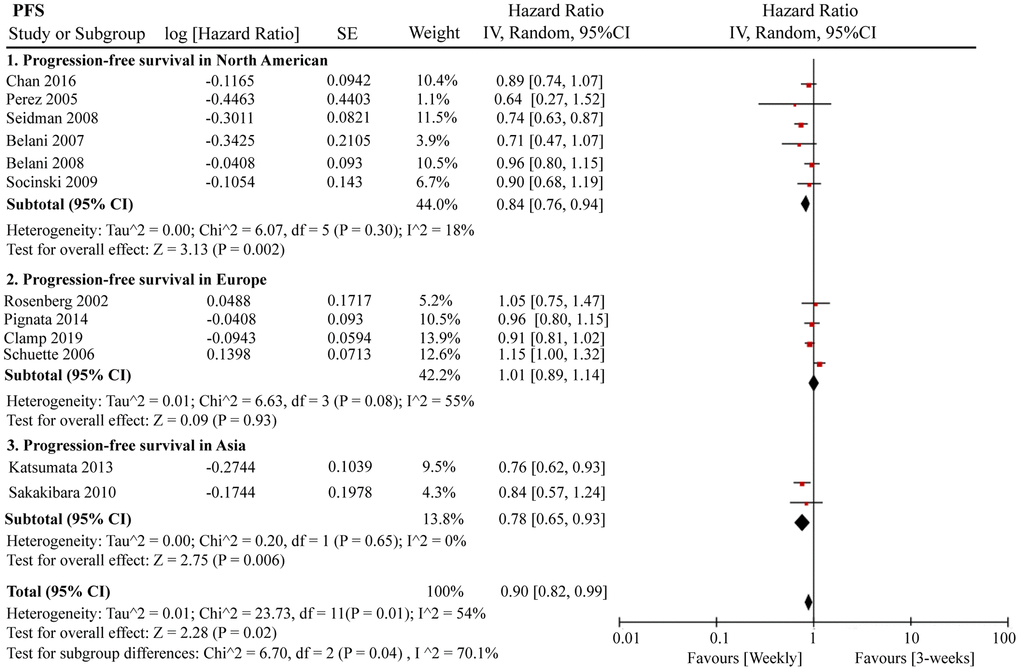
Figure 5.
The forest plot of HR for PFS in the subgroup analysis based on the ethnic differences.
HR: hazard ratio; PFS: progression-free survival.