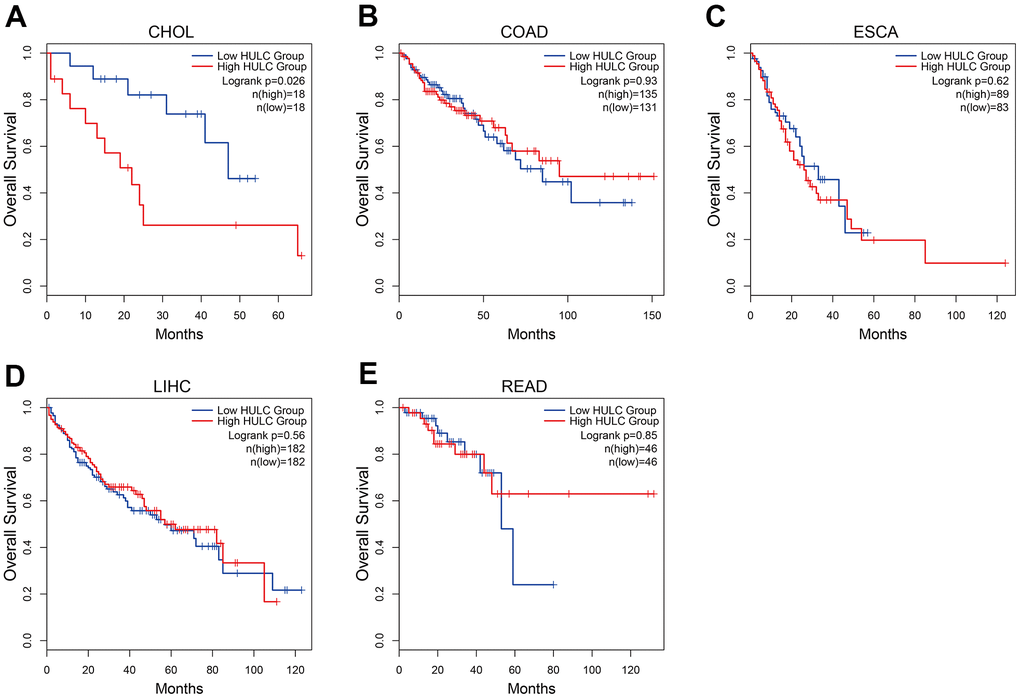
Figure 8.Kaplan–Meier curves showing the prognostic value of HULC in TCGA and GTEx data set. (A) The Kaplan–Meier curve of CHOL; (B) The Kaplan–Meier curve of COAD; (C) The Kaplan–Meier curve of ESCA; (D) The Kaplan–Meier curve of LIHC; (E) The Kaplan–Meier curve of READ. CHOL: cholangiocarcinoma; COAD: colon adenocarcinoma; ESCA: esophageal carcinoma; LIHC: liver hepatocellular carcinoma; READ: rectum adenocarcinoma.