Submit an Article
Navigate
Home
Editorial Board
Editorial Policies
Current Volume
Archive
Scientific Integrity
Publication Ethics Statements
Interviews with Outstanding Authors
Newsroom
Sponsored Conferences
Podcast
Contact
Special Collections
Submit an Article
Online ISSN: 1945-4589
Research Paper
|
Volume 14, Issue 4
|
pp. 1797–1811
LncRNA HULC as a potential predictor of prognosis and clinicopathological features in patients with digestive system tumors: a meta-analysis
Back to article
Figure 3
(3 of 8)
−
100%
+
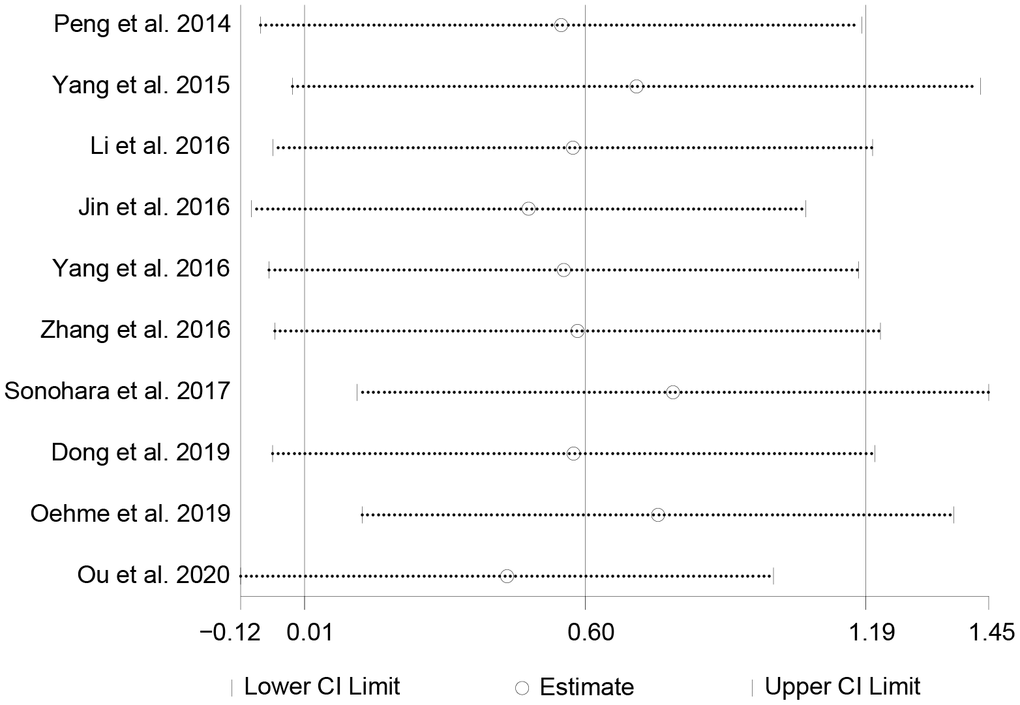
Figure 3.
The sensitivity analysis on the correlation between HULC expression level and OS.