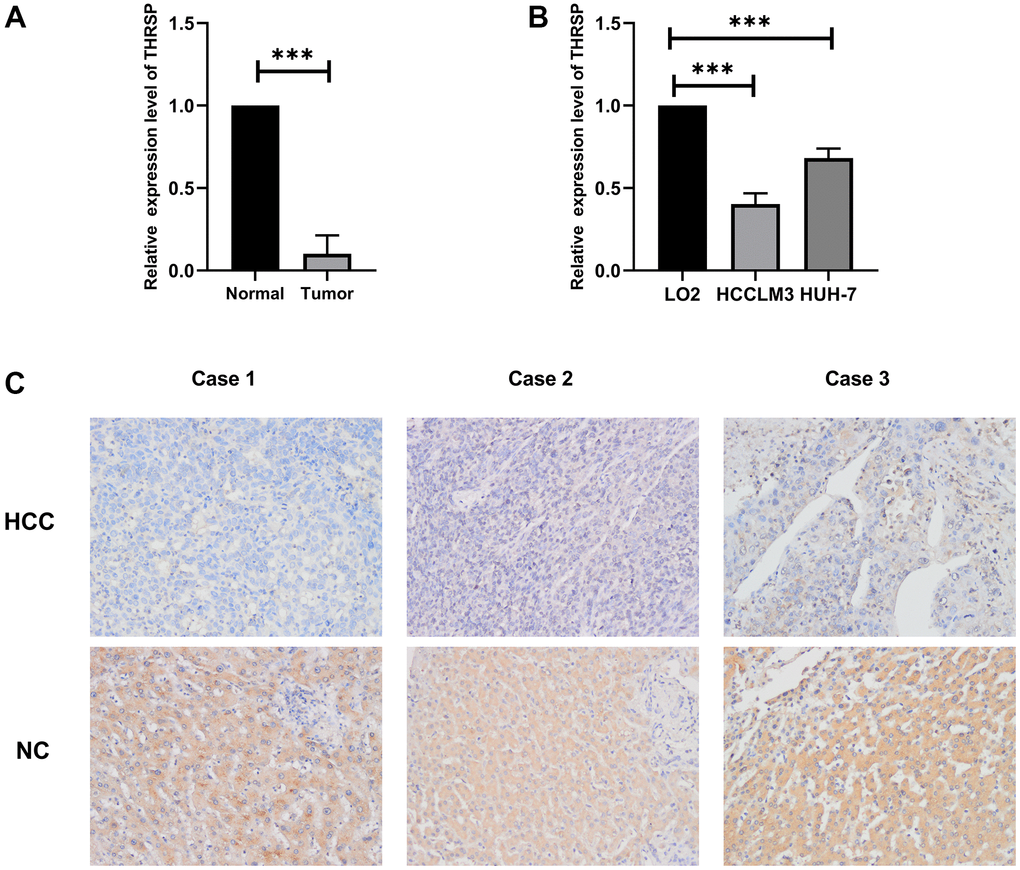
Figure 5.The expression of THRSP at mRNA and protein levels. (A, B) The mRNA expression of THRSP in HCC tissues and cells compared with control examined by RT-qPCR. (C) The protein expression of THRSP in HCC tissues and the adjacent normal tissues examined by immunohistochemical (200×).