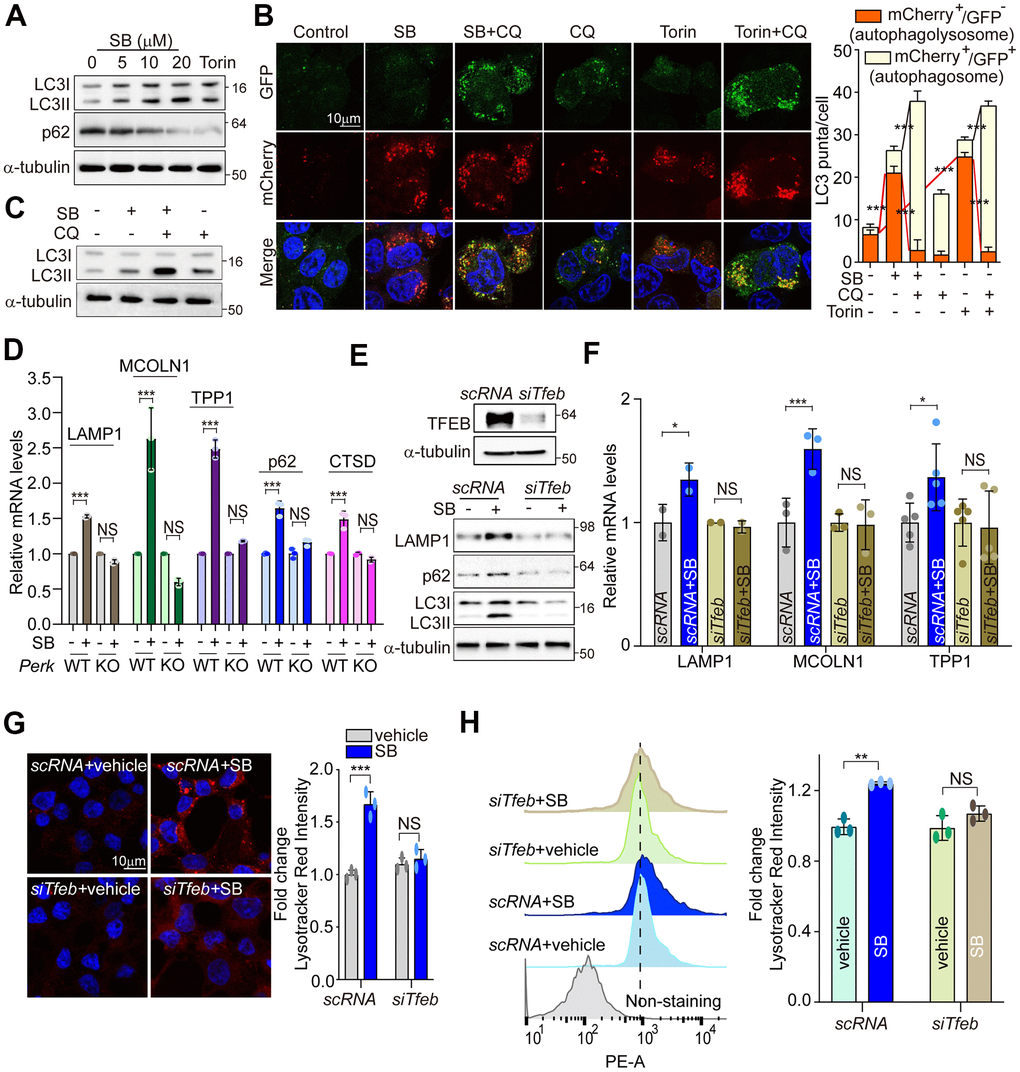
Figure 5.PERK activation by SB202190 facilitates autophagy and lysosome biogenesis via TFEB activation. (A) SH-SY5Y cells were treated for 6 h with SB202190 (5, 10, and 20 μM) and subjected to western blotting by antibodies against p62 and LC3B. (B) SH-SY5Y cells were transiently transfected with mCherry-GFP-LC3 for 48 h and subsequently pretreated with chloroquine (CQ, 10 μM) for 1 h, and then treated with SB (20 μM) or Torin1 (2 μM) for 6 h. Cells were observed for fluorescence of both GFP and mCherry using confocal microscopy. The number of autolysosomes (GFP-RFP+) and autophagosomes (GFP+RFP+) per cell in each condition were quantified. Data represent mean ± SD; ***p<0.001. (C) SH-SY5Y cells were treated with CQ (10 μM) for 1 h before SB202190 (20 μM) for 6 h. The levels of LC3B-II conversion were analyzed by western blotting. (D) To check of PERK dependence in ALP-related genes, Perk+/+ and Perk-/- MEFs were treated with SB202190 (20 μM) for 6 h. Lysosomal genes (LAMP1, MCOLN1, TPP1, and CTSD) and autophagy gene (p62) measured by qRT-PCR. Data represent mean ± SD; ***p<0.001, NS, not significant. (E–H) SH-SY5Y cells were transfected with siTfeb for 48 h and then treated with SB202190 (20 μM) for 6 h. (E) Cells were subjected to western blotting by using antibodies against TFEB upper, LAMP1, p62, and LC3B lower. (F) lysosomal genes, LAMP1, MCOLN1, and TPP1, were measured by qRT-PCR. Data are represented as mean ± SD; *p<0.05, ***p<0.001, NS, not significant. (G) Samples were stained with Lysotracker Red. Representative image was obtained by confocal microscopy (left). Scale bar, 10 μm. Quantification of lysosome intensity was determined by counting red puncta (right). Data represent mean ± SD; ***p<0.001, NS, not significant. (H) LysoTracker fluorescence was measured by flow cytometry. Fold changes in LysoTracker intensity are indicated at the right and are presented as mean ± SD (n=3); **p<0.01, NS, not significant.